Section: Software
Visualization Tools
Zephyr - Visualization Platform
Participant : Thomas Degris [correspondant] .
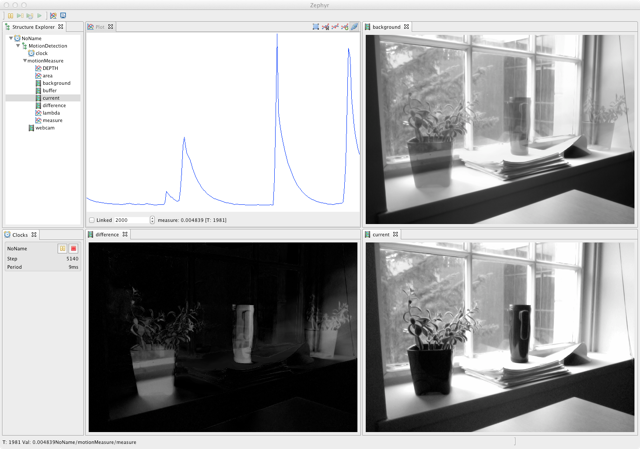
Zephyr is a software in Java and Eclipse Rich Client Platform to visualize numeric variables and data structure in real time and at different time scale. Zephyr is practical for developers because it requires only minimal changes in the code to debug: it uses Java reflexivity to automatically detect variables in the code to monitor and data structure with an associated dedicated view. Zephyr can easily be extended with new plugins because it is based on the popular Eclipse Rich Client Platform. Consequently, Zephyr takes advantage of already existing and fully operational Eclipse plugins for many of its functionalities. Finally, Zephyr is distributed with a Java python virtual machine named Jython and a lisp implementation named Clojure. An example of a Zephyr screen is shown in Figure 11 .
Zephyr was started in fall 2009 in the RLAI group at the university of Alberta (Canada) when Thomas Degris was a postdoc in this group. Zephyr is still actively used by RLAI. Users include Adam White, Joseph Modayil and Patrick Pilarski from the University of Alberta. Moreover, Zephyr has been registered on the Eclipse marketplace since October 2011 where it has been downloaded a few times by anonymous users. Future dissemination includes the implementation of demos and tutorial videos. Documentation about Zephyr is included on http://thomasdegris.github.com/zephyr/ . Zephyr is licensed under the open source Eclipse Public License.
|
Bloom - particle-based physical engine
Participants : Fabien BENUREAU [correspondant] , Olivier Mangin [correspondant] .
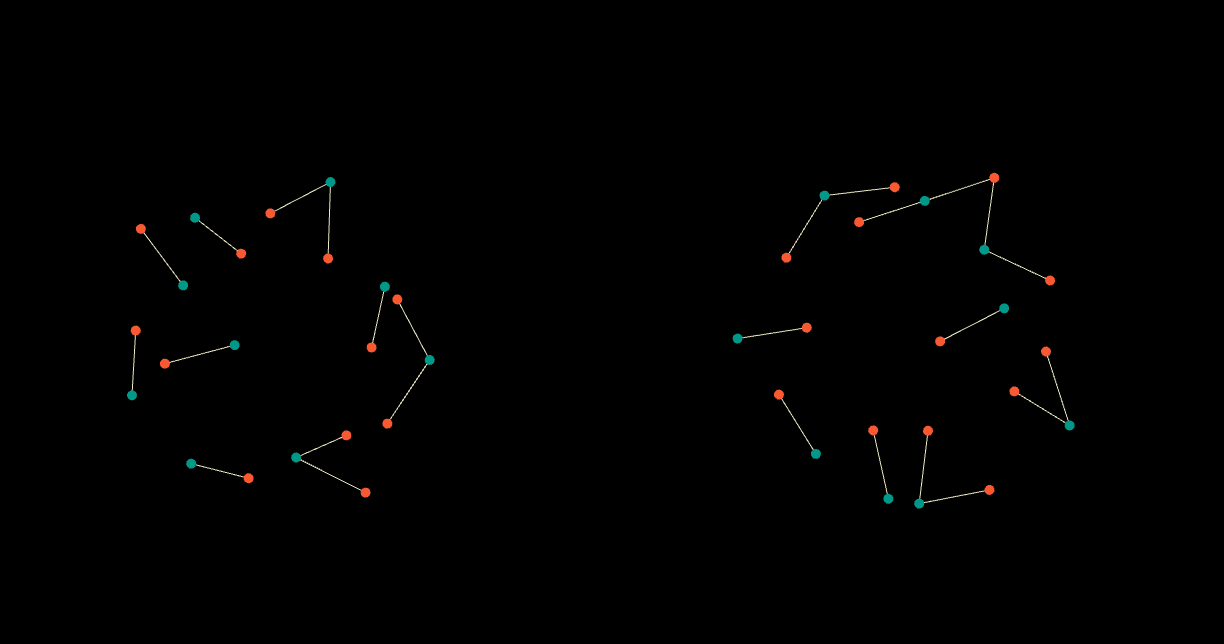
Bloom is a particle-based physical engine that was coded for the Ergorobot exhibition. Written in a matter of days in September 2011, Bloom is based on Processing and coded in Java. It is currently running all of the projected visualisation of the Ergorobot installation. Bloom greatest strength is to provide an intuitive and lightweight tool to display of complex and dynamic information, such a the morphology of a robot vocabulary, as shown in Figure 12 . As such, it should permit to examine the state of complex data structure in real-time during experiment, getting insights and allow detection and tracking of issues in algorithms being developed. Bloom is a great complement in research work to the use of charts and graphs. Bloom has since be made available and presented to the team in December 2011.
|