Section: New Results
Statistical methods
Change detection on synthetic aperture radar images based on hypothesis testing
Participants : Vladimir Krylov, Josiane Zerubia [contact] .
This work was conducted in collaboration with DITEN, University of Genoa with Dr. Gabriele Moser and Prof. Sebastiano Serpico (http://spt.dibe.unige.it/ ) with the support of the Italian Space Agency, ASI (http://www.asi.it/en ).
Change detection, synthetic aperture radar, hypothesis test, likelihood ratio test, high resolution
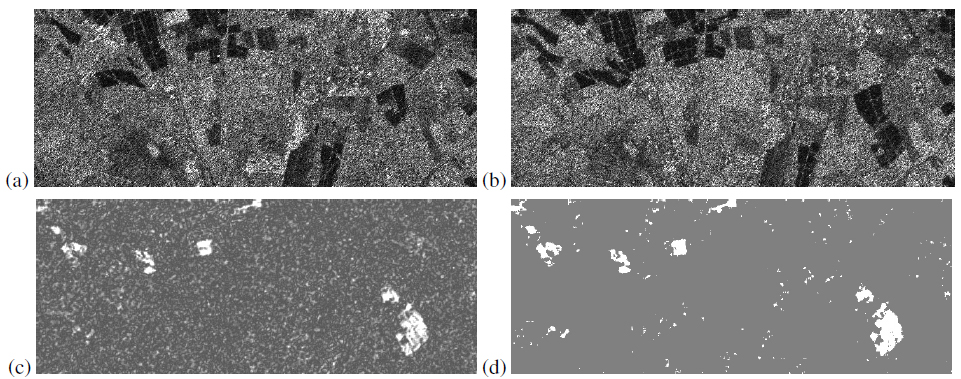
Modern synthetic aperture radar (SAR) sensors represent an essential source of all-weather and 24-hour imagery with a fixed re-visit cycle at competitive high resolution. Two-date change detection from SAR images is a process that employs two SAR images acquired over the same geographical area with possibly the same (or close) acquisition characteristics at two different times to map the areas where changes occur between the two acquisition dates. The central disadvantage of the SAR imagery is given by an inherent multiplicative speckle noise, which restricts the direct application of optical-based change detection methods to SAR imagery.
We have developed a non-parametric statistical change detection approach. We avoided the ambiguity of choosing a restrictive clutter model by assuming no specific probability distribution function model [25] for the statistics of SAR. We developed a modified hypothesis test which is based on the classical Wilcoxon two-sample test that verifies whether one of two samples of independent observations tends to have larger values than the other. The choice of the Wilcoxon statistic as compared to the other available goodness-of-fit test statistics, such as, e.g., that of Cramér-von Mises' test, is a compromise solution to have simultaneously an analytically tractable asymptotic distribution (which is needed to formulate the likelihood ratio test) and a non-parametric testing procedure. Furthermore, the experimental validation demonstrated the adequacy of this statistic to the considered problem. To be able to take a decision at each pixel of the coregistered image pair we considered samples originating from the local windows centered in each pixel. Finally, we constructed a likelihood ratio test on the image with Wilcoxon statistic values. This formulation allowed to overcome the limitation of a classical independency assumption for the Wilcoxon test which is violated (at least, locally) with the local window samples. The resulting technique is related to the statistical false discovery rate approach developed for “large-scale simultaneous hypothesis testing” problems, however the derivation and interpretation are different.
Encouraging detection results were obtained on XSAR and very high resolution COSMO-SkyMed images [14] .
|
Statistical analysis of skin pigmentation under treatment
Participants : Sylvain Prigent, Xavier Descombes, Josiane Zerubia [contact] .
This work was partially funded by a contract with Galderma R&D (http://www.galderma.com/RampD.aspx ). It was a collaboration between AYIN (Josiane Zerubia) and Morpheme (Xavier Descombes) teams.
multispectral imaging, skin, hyperpigmentation, hypothesis tests, statistical inferences
One of the steps to evaluate the efficacy of a therapeutic solution is to test it on a clinical trial involving several populations of patients. Each population receives a studied treatment and a reference treatment for the disease.
For facial hyper-pigmentation, a group of patients receives the treatment on one cheek and a comparator on the other. The comparator can be a reference treatment or a placebo. To this end patients are selected to have the same hyper-pigmentation severity on the two cheeks. Then multi-spectral images are taken at different time along the treatment period.
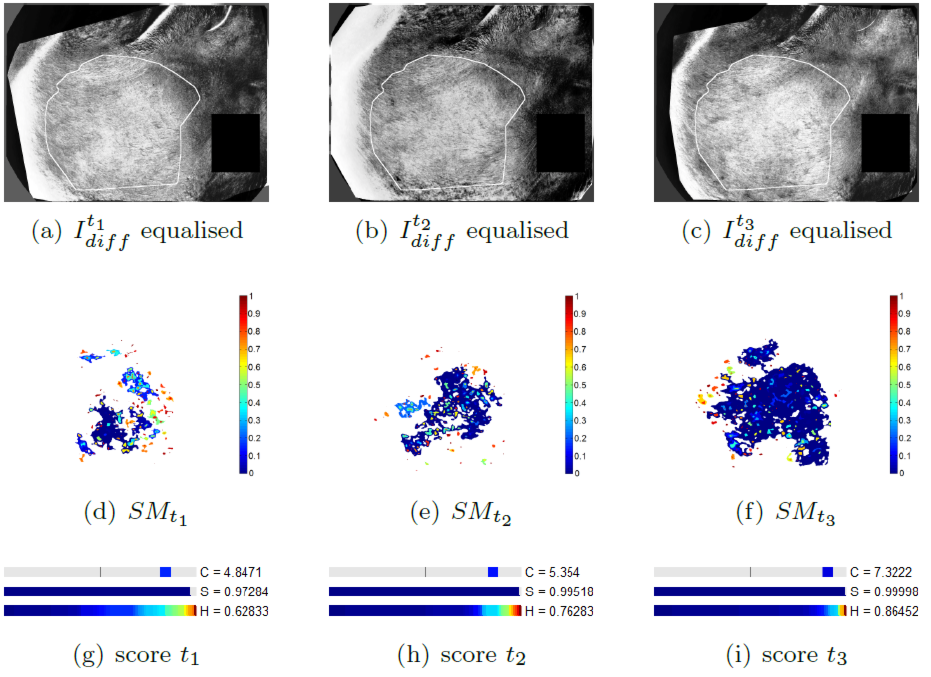
We proposed a methodology to estimate the efficacy a treatment by calculating three differential criteria: the darkness, the area and the homogeneity. The darkness measures the average intensity of the disease on a gray scaled image obtained by a linear combination of the spectral bands of the original multi-spectral image. A differential darkness is then obtained by measuring the deviation between the initial measurement at time , and the measurement at time . The differential area criterion is calculated by analyzing the histogram of a difference gray scale image between two measurements in a time series. The differential homogeneity criterion is obtained with a multi-scale analysis of adapted from the Statistical Parametric Mapping (SPM) methodology. Indeed, statistical inferences allow to assign a probability of change to each region of above a set of thresholds. These probabilities are calculated with respect to the maximum intensity and the spatial extend of each region. An integration of the obtained statistical map denoted , allows to get a homogeneity criterion.
The Fig. 8 illustrates the differential score calculated on a patient whose pathology decreases during the clinical trial. The proposed differential score has been tested in a full clinical study and provided results that agreed with the clinical analysis. This work have been patented, submitted to ISBI'13 conference and to the IEEE TMI journal, and published in Inria research reports [26] , [27] .