Section: New Results
Hierarchical models
Hierarchical and graph cut-based models for multiyear sea ice floe segmentation
Participant : Yuliya Tarabalka [contact] .
This work has been done in collaboration with Dr. Guillaume Charpiat (STARS team, Inria-SAM), Dr. Ludovic Brucker (NASA GSFC, USA) and Dr. James Tilton (NASA GSFC, USA).
hierarchical model, graph cut, segmentation, multiyear sea ice floes, shape analysis
The melting of sea ice is correlated to increases in sea surface temperature and associated climatic changes. Therefore, it is important to investigate how rapidly sea ice floes melt. We proposed two methods for segmentation of a time series of a melting sea ice floe. The first method employs hierarchical model for ice floe segmentation. Image features are extracted using morphological operators, and the floe of interest is marked based on AMSR-E satellite measurements. Then, hierarchical step-wise optimization segmentation is performed, by iteratively merging adjacent regions with the smallest dissimilarity criterion. We proposed to use area and shape parameters of the floe at two previous time moments as priors for computing a segmentation map at the next time moment.
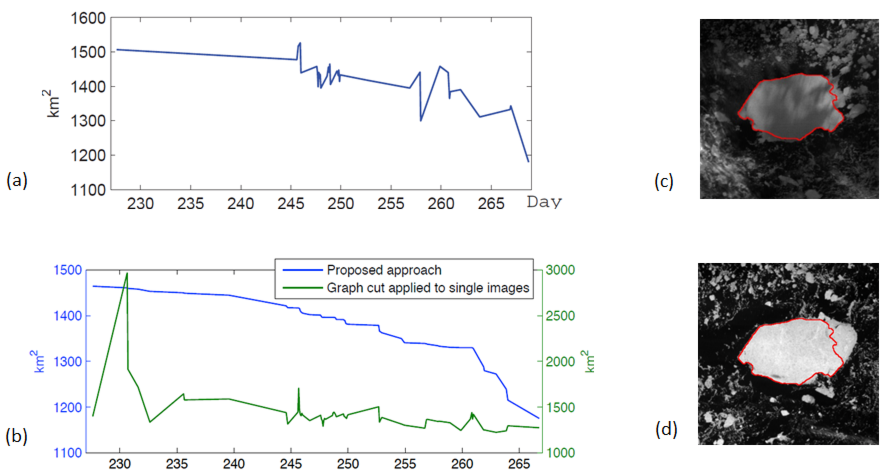
Fig. 9 (a) depicts a graph of the multiyear ice floe area as a function of time, computed by applying the proposed hierarchical model to the summer series of Moderate-Resolution Imaging Spectroradiometer (MODIS) images. While a multiyear ice floe can only melt in the summer period, peaks on the graph correspond to segmentation errors, which are a consequence of either a cloud cover or weakness of contrast between the multiyear ice and the surrounding young ice floes. These segmentation imprecisions can be avoided by simultaneously optimizing all segmentation maps in a time series. For this purpose, we developed a new method based on graph cuts for joint segmentation of monotonously shrinking (or growing) shapes. We impose shape shrinkage (or growth, respectively) constraint in graph cuts, and minimization of energy computed on the resulting graph of the image sequence yields globally optimal segmentation. Fig. 9 (c-d) show examples of floe segmentations using the new approach. Fig. 9 (b) presents a graph of the floe area as a function of time computed by performing the proposed graph cut-based method. The results are compared to those obtained by applying graph cut segmentation to each single image in the considered time series. It can be seen that the new approach yields results with continuous shrinkage of the shape size.
|
Hierarchical model for spectral-spatial classification of hyperspectral images
Participant : Yuliya Tarabalka [contact] .
This work has been done in collaboration with Dr. James Tilton (NASA GSFC, USA).
hyperspectral images, classification, segmentation, geometrical features, rectangularity.
The recent advances in hyperspectral remote sensor technology makes it possible to acquire data with a very high spectral (hundreds of spectral channels) and spatial (order of a meter) resolution. The rich spectral information of the hyperspectral data leads to the potential of a more accurate classification, but also presents challenges of high-dimensional data analysis.
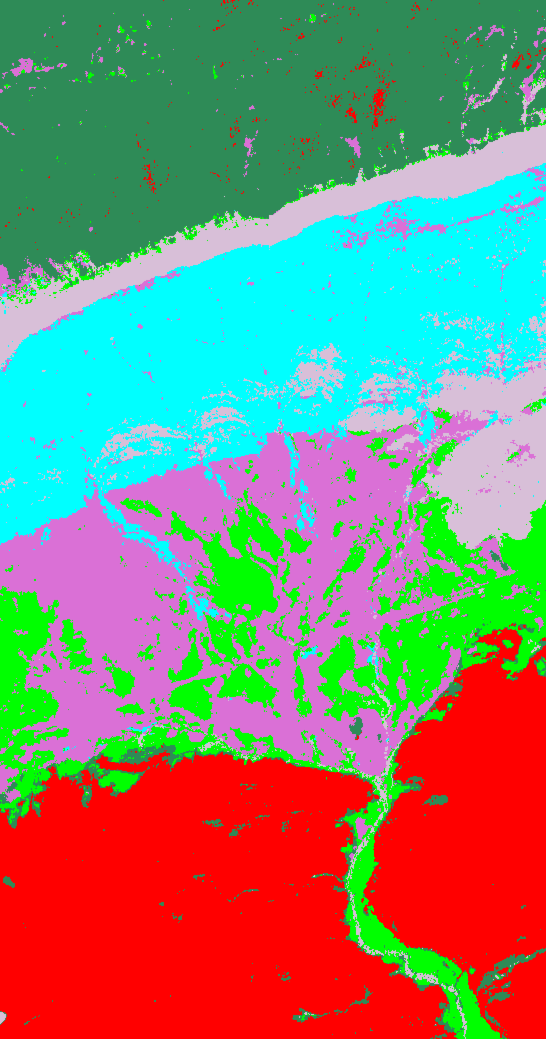
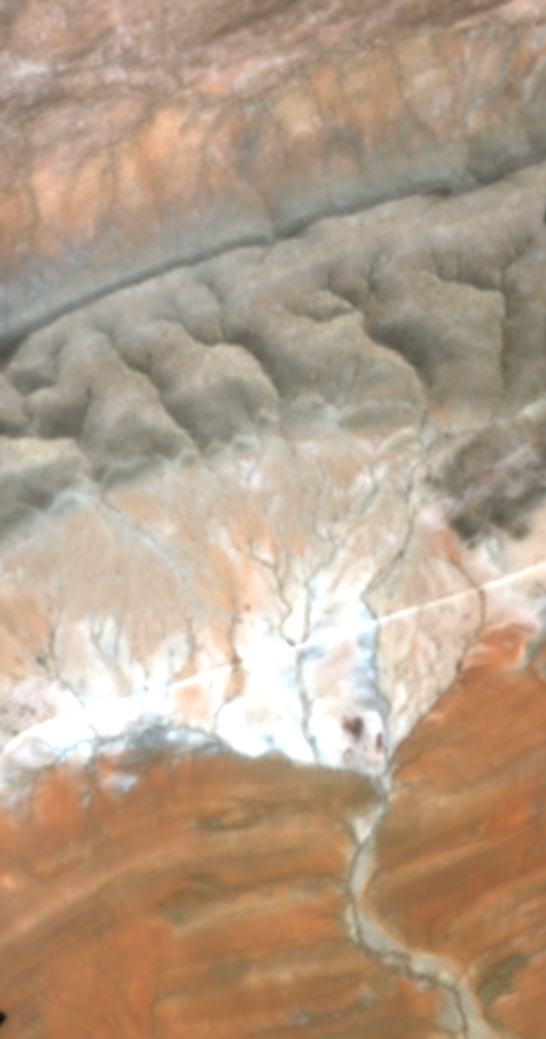
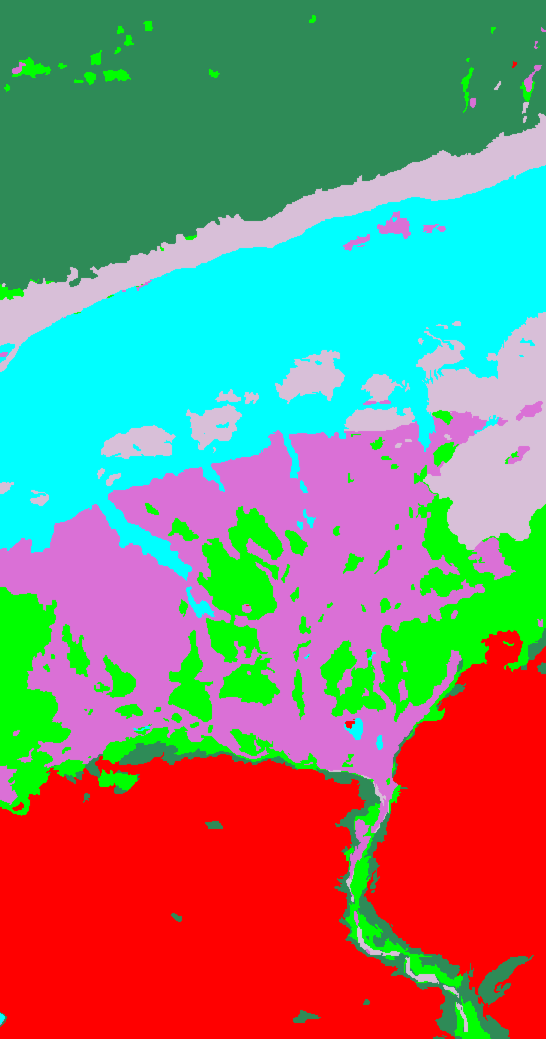
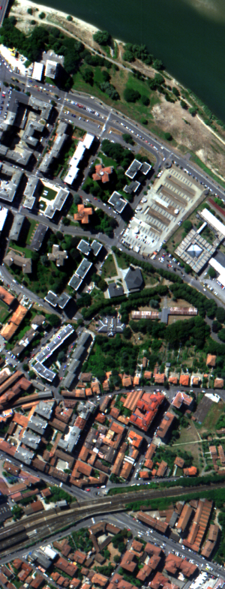
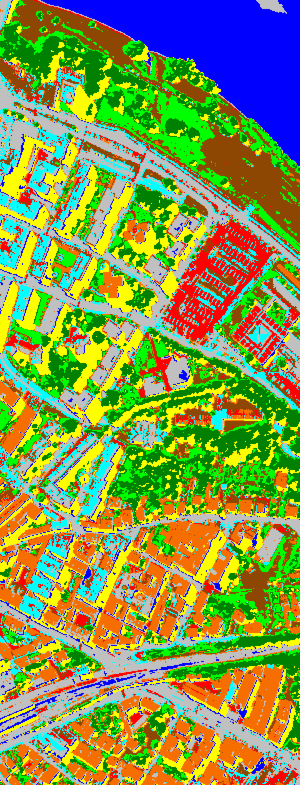
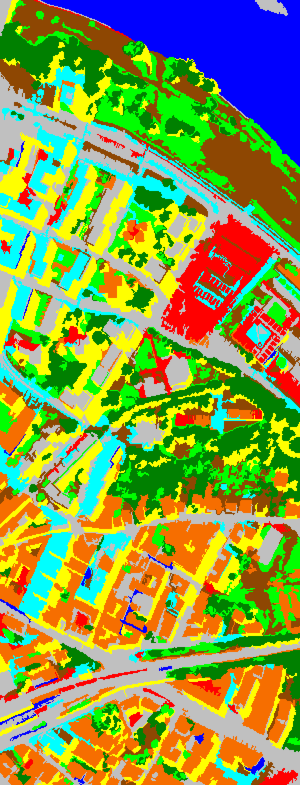
We developed a new method for spectral-spatial classification of hyperspectral images. The method is based on the integration of probabilistic classification and shape analysis within the hierarchical step-wise optimization algorithm. First, probabilistic support vector machines classification is applied. Then, at each iteration two neighboring regions with the smallest dissimilarity criterion are merged, and classification probabilities are recomputed. We proposed to estimate a dissimilarity criterion between regions as a function of statistical, classification and geometrical (area and rectangularity) features. Fig. 10 shows the obtained classification results on a 102-band ROSIS image of the Center of Pavia, Italy, which are compared with Support Vector Machines (SVM) classification results. These results did show that the proposed method succeeded in taking advantage of both spatial and spectral information for accurate hyperspectral image classification.
|
Classification of combined hyperspectral and panchromatic data using spectral-spatial approaches
Participants : Yuliya Tarabalka [contact] , Josiane Zerubia.
This work has been conducted in collaboration with the French Space Agency CNES (http://www.cnes.fr/ ), with Dr. Marie-José Lefèvre, Dr. Hélène DeBoissezon and Mr. Manuel Grizonnet.
hyperspectral data, HYPXIM, data fusion, panchromatic image, segmentation
Hyperspectral imaging records a detailed spectrum for each pixel, opening new perspectives in classification. Currently, several hyperspectral satellite missions such as EnMAP (210 bands, GSR 30m) are under development. The future hyperspectral satellite missions PRISMA and HYPXIM also include a panchromatic channel with better spatial resolution. We explored if a panchromatic channel at a higher spatial resolution (factor 4) contributes for more accurate classification of hyperspectral images in space conditions.
We adapted and compared several classification methods for combined hyperspectral and panchromatic images, and conducted experiments on the simulated HYPXIM data provided by CNES. We fused both data sources using principal component and Gram-Schmidt fusion methods, as well as the vector stacking approach. We then applied Support Vector Machines (SVM) classification on the resulting feature sets. Furthermore, we considered spatial information for more accurate classification by: (1) including Haralick's texture features in the feature set; (2) segmenting an image into homogeneous regions using a Hierarchical Step-Wise Optimization (HSWO) technique, and assigning each segmented region to the dominant class within this region.
Classification results are illustrated in Fig. 11 . We concluded that classification accuracies of the HYPXIM simulated data have been improved when including a panchromatic channel at a higher spatial resolution into a classification system. These results are close to hyperspectral aerial data classifications. For the image containing one-pixel regions and mixed pixels, standard spectral-spatial classification methods are not well adapted and thus do not improve accuracies when compared to pixelwise classification. In the future, we plan to develop methods which would use both spatial information and a spectral unmixing concept for efficient fusion of hyperspectral and panchromatic data.
|