Section:
New Results
Multiresolution analysis and optimal inference for high resolution ocean dynamics and ocean/atmosphere fluxes
Participants :
Hussein Yahia [correspondant] , Véronique Garçon, Oriol Pont, Joel Sudre, Christine Provost, Antonio Turiel, Christoph Garbe, Claire Pottier, Boris Dewitte.
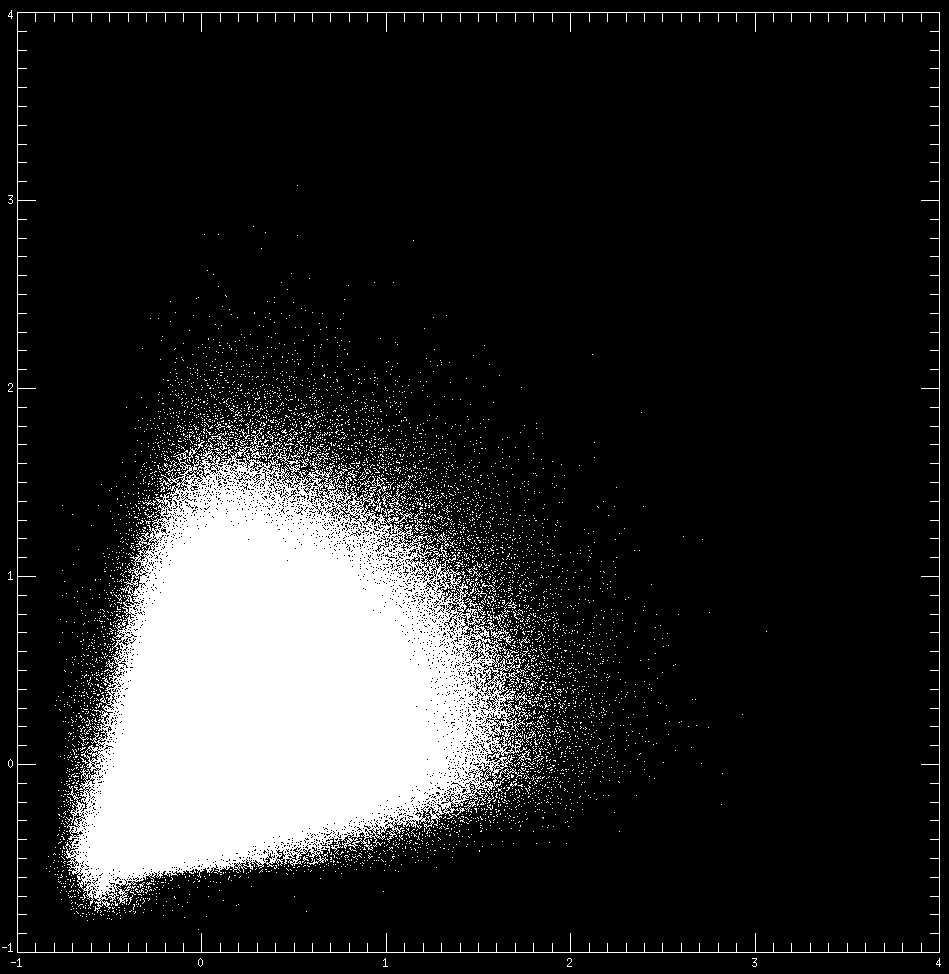
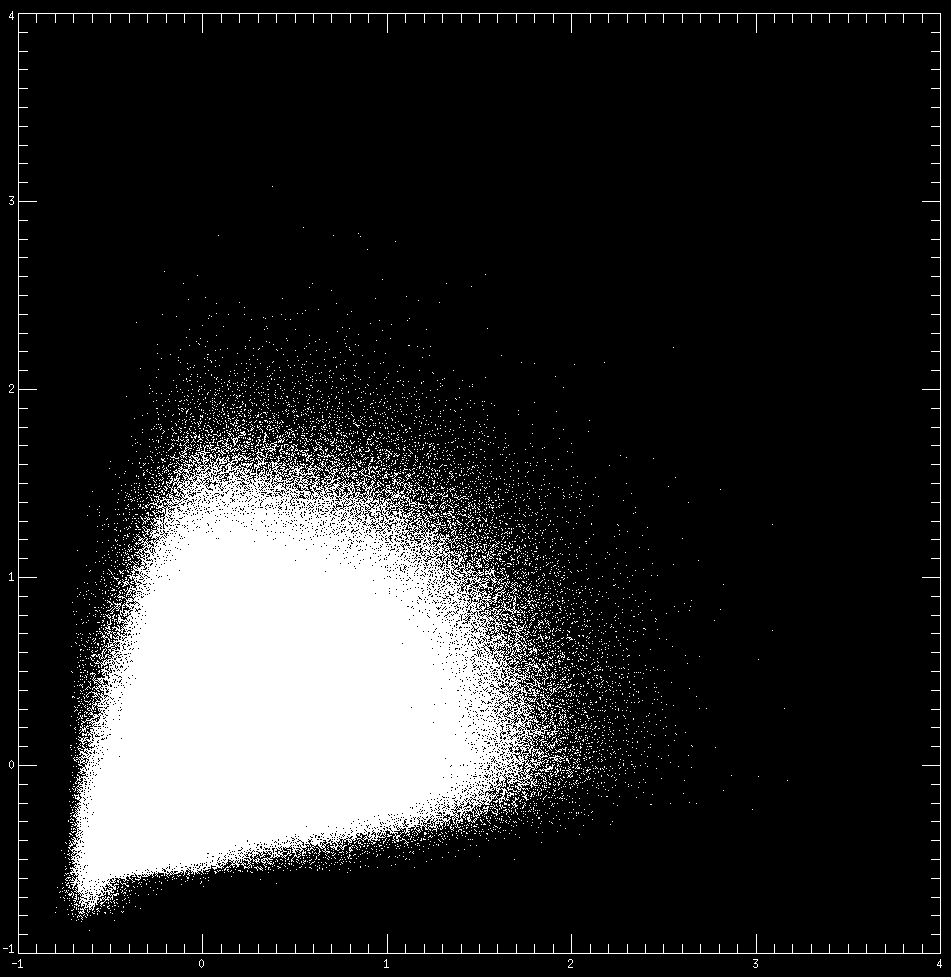
A signal computed as an output from the ROMS coupled
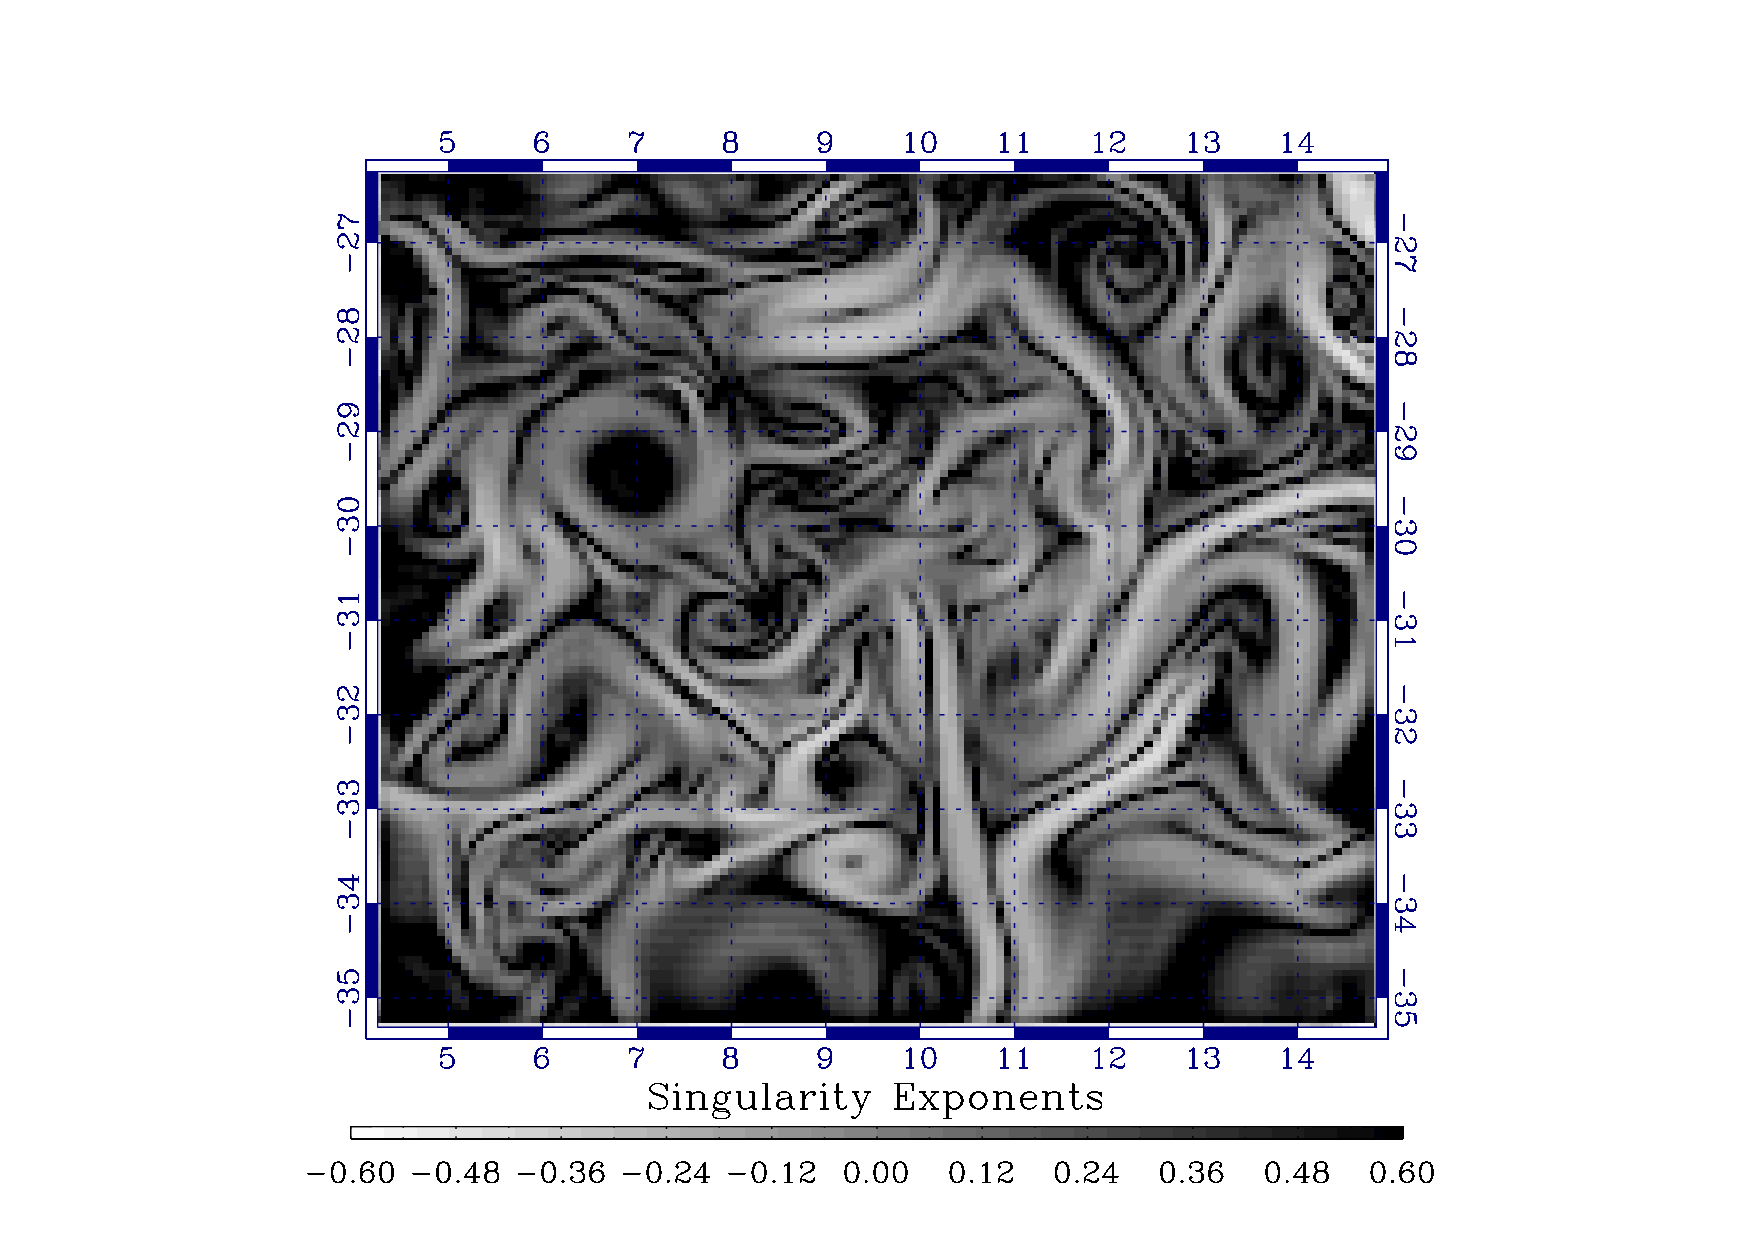
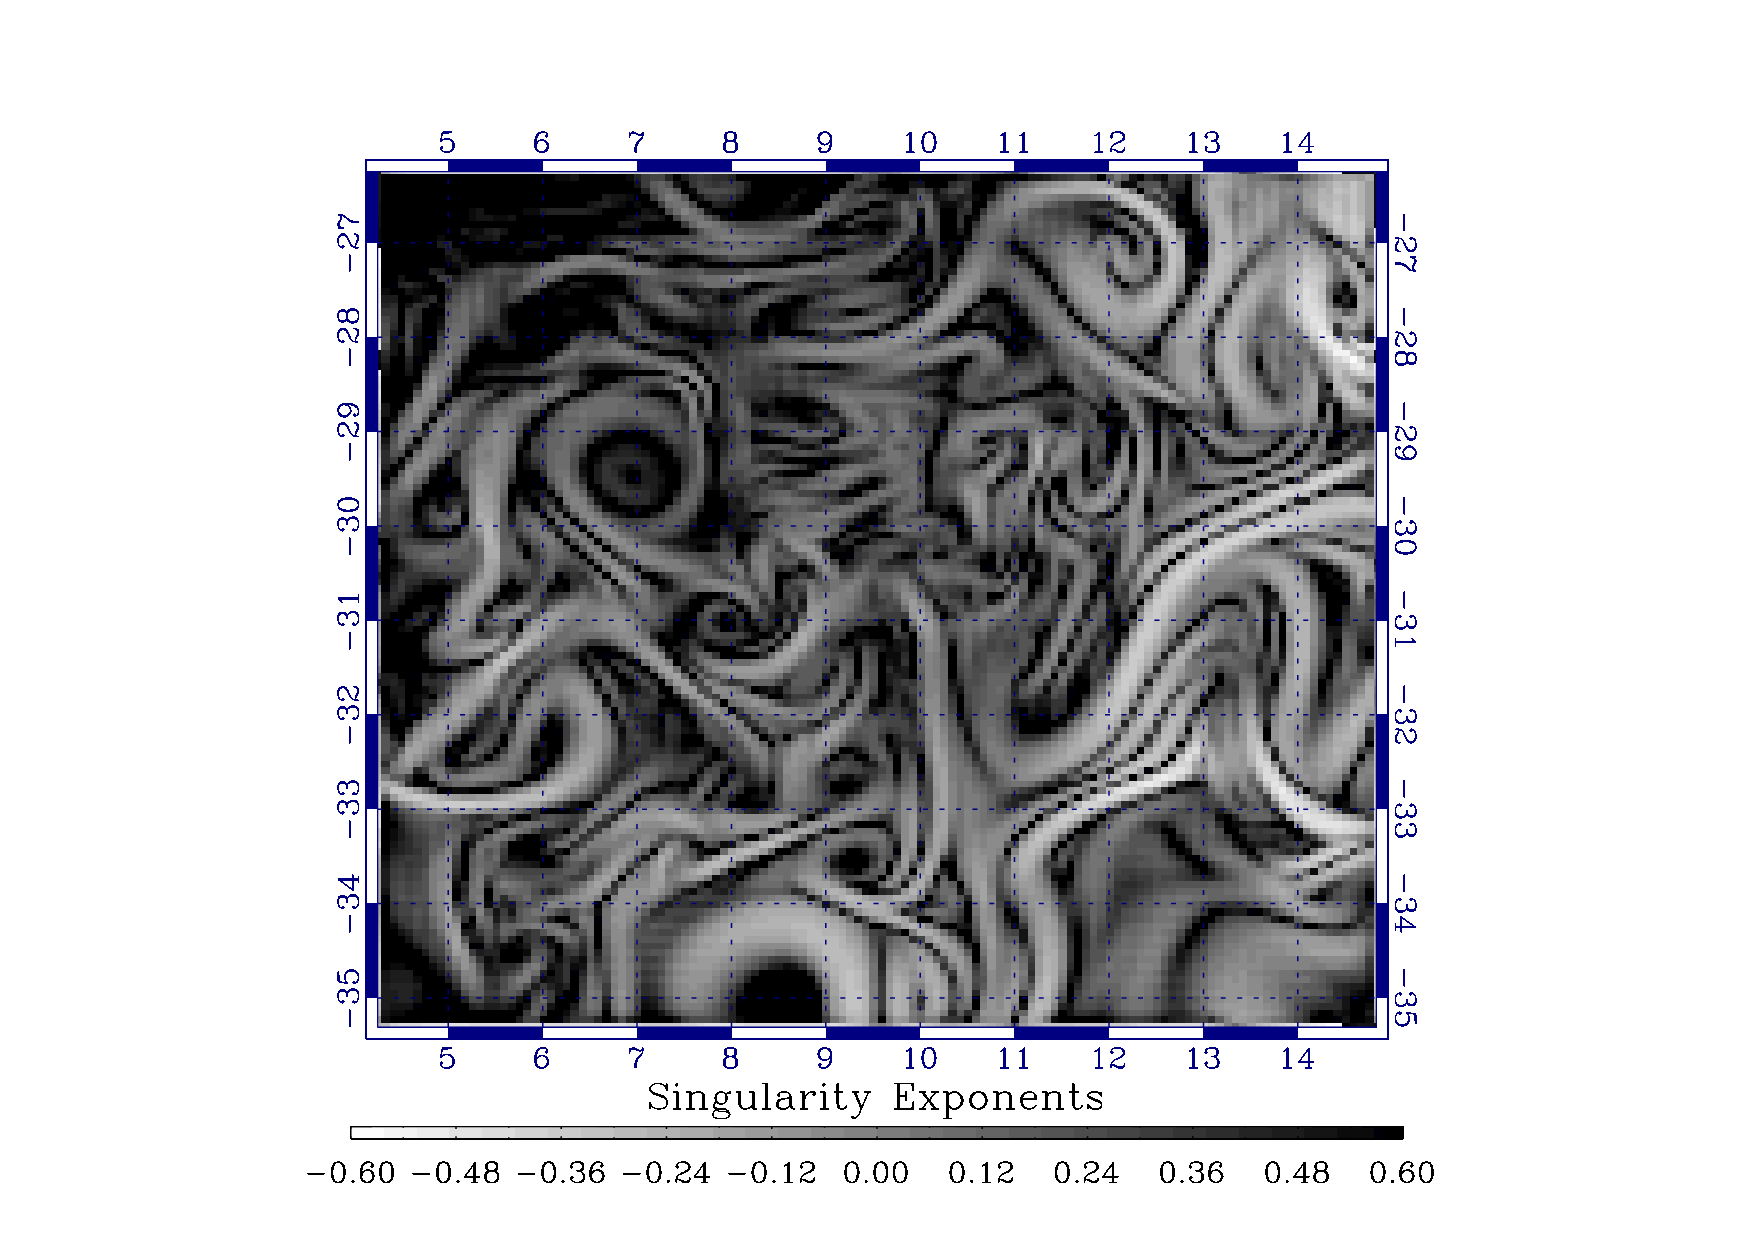
physical/biogeochemical simulation model possesses the characteristics of the presence of a multiscale organization, typical of turbulence, which can be evidenced by the computation of singularity spectra. The multiscale organization is related to the cascading properties of intensive variables acquired from the underlying system. We show how to perform inference along the scales in order to build higher resolution of maps. Figure 4 illustrates clearly one of the main ideas implemented in this study: coherent structures of and SST (Sea Surface Temperature) signals are related, and the LPEs, which are dimensionless quantities recording transition strengths in a signal, encode properly the multiscale transitions.
Figure
4. Local Predictability Exponents (LPEs) of ROMS-simulated signal (left) and of corresponding SST (Sea Surface Temperature) generated signal (right). Transitions are are visually and quantitatively correlated, although not the same. |
We perform a linear regression test:
| (8) |
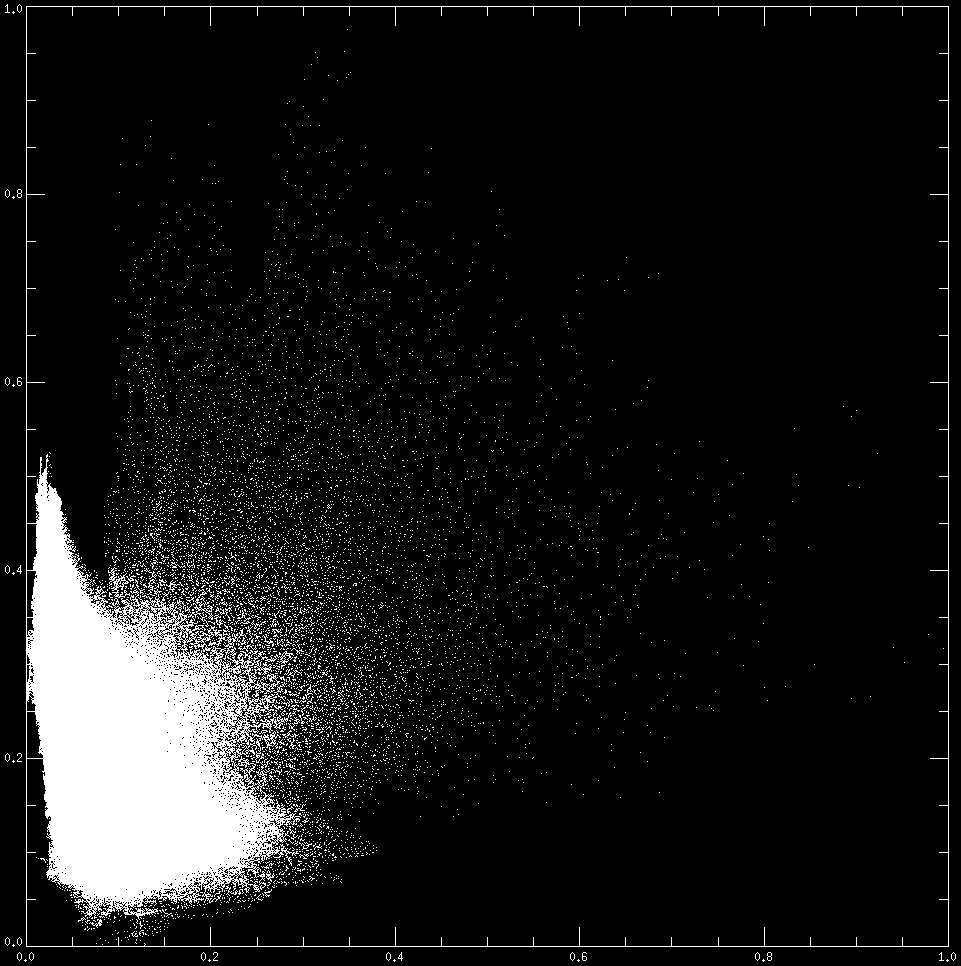
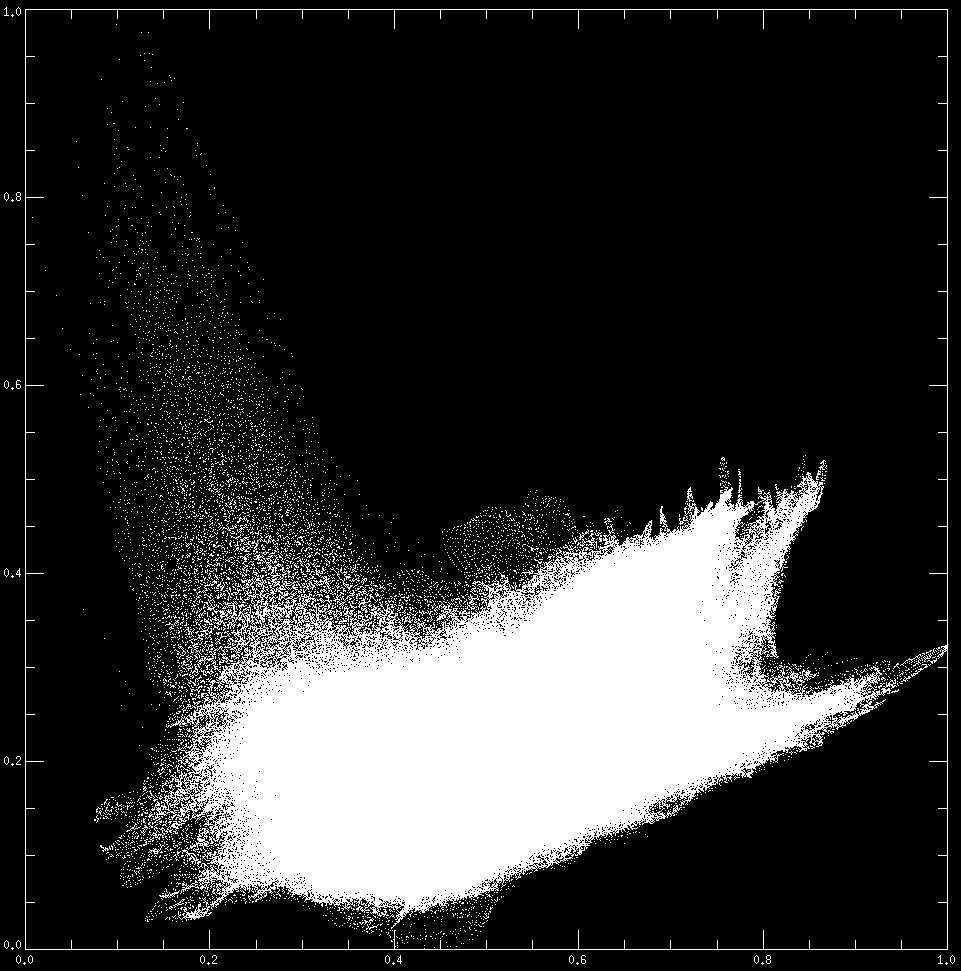
with : LPE of at x, : LPE of SST at x, : LPE of CHLa signal at x (CHLa: ocean colour data, corresponding to chlorophyl concentration). Tests are conducted over a period of 10 years on ROMS simulated data, with images corresponding to pixels for the high resolution and for the low resolution. There is one data every 10 days. In figure 5 we compare the functional dependencies of vs. SST and CHLa with those of the corresponding LPEs: the original signals are physical variables of different dimensions, with complex undetermined functional dependencies. On the contrary, the dimensionless LPEs of these variables, which record the multiscale transitions, display clearly a much simpler dependency, approximated at satisfactory precision by a linear regression.
Figure
5. Pictures indicating the nature of the functional dependencies of vs. CHLa (top left), of vs. SST (top right), of vs (bottom left) and of vs (bottom right). The dependencies are computed on a 10-year ROMS simulation dataset, with a time frequency of one every 10 days. |
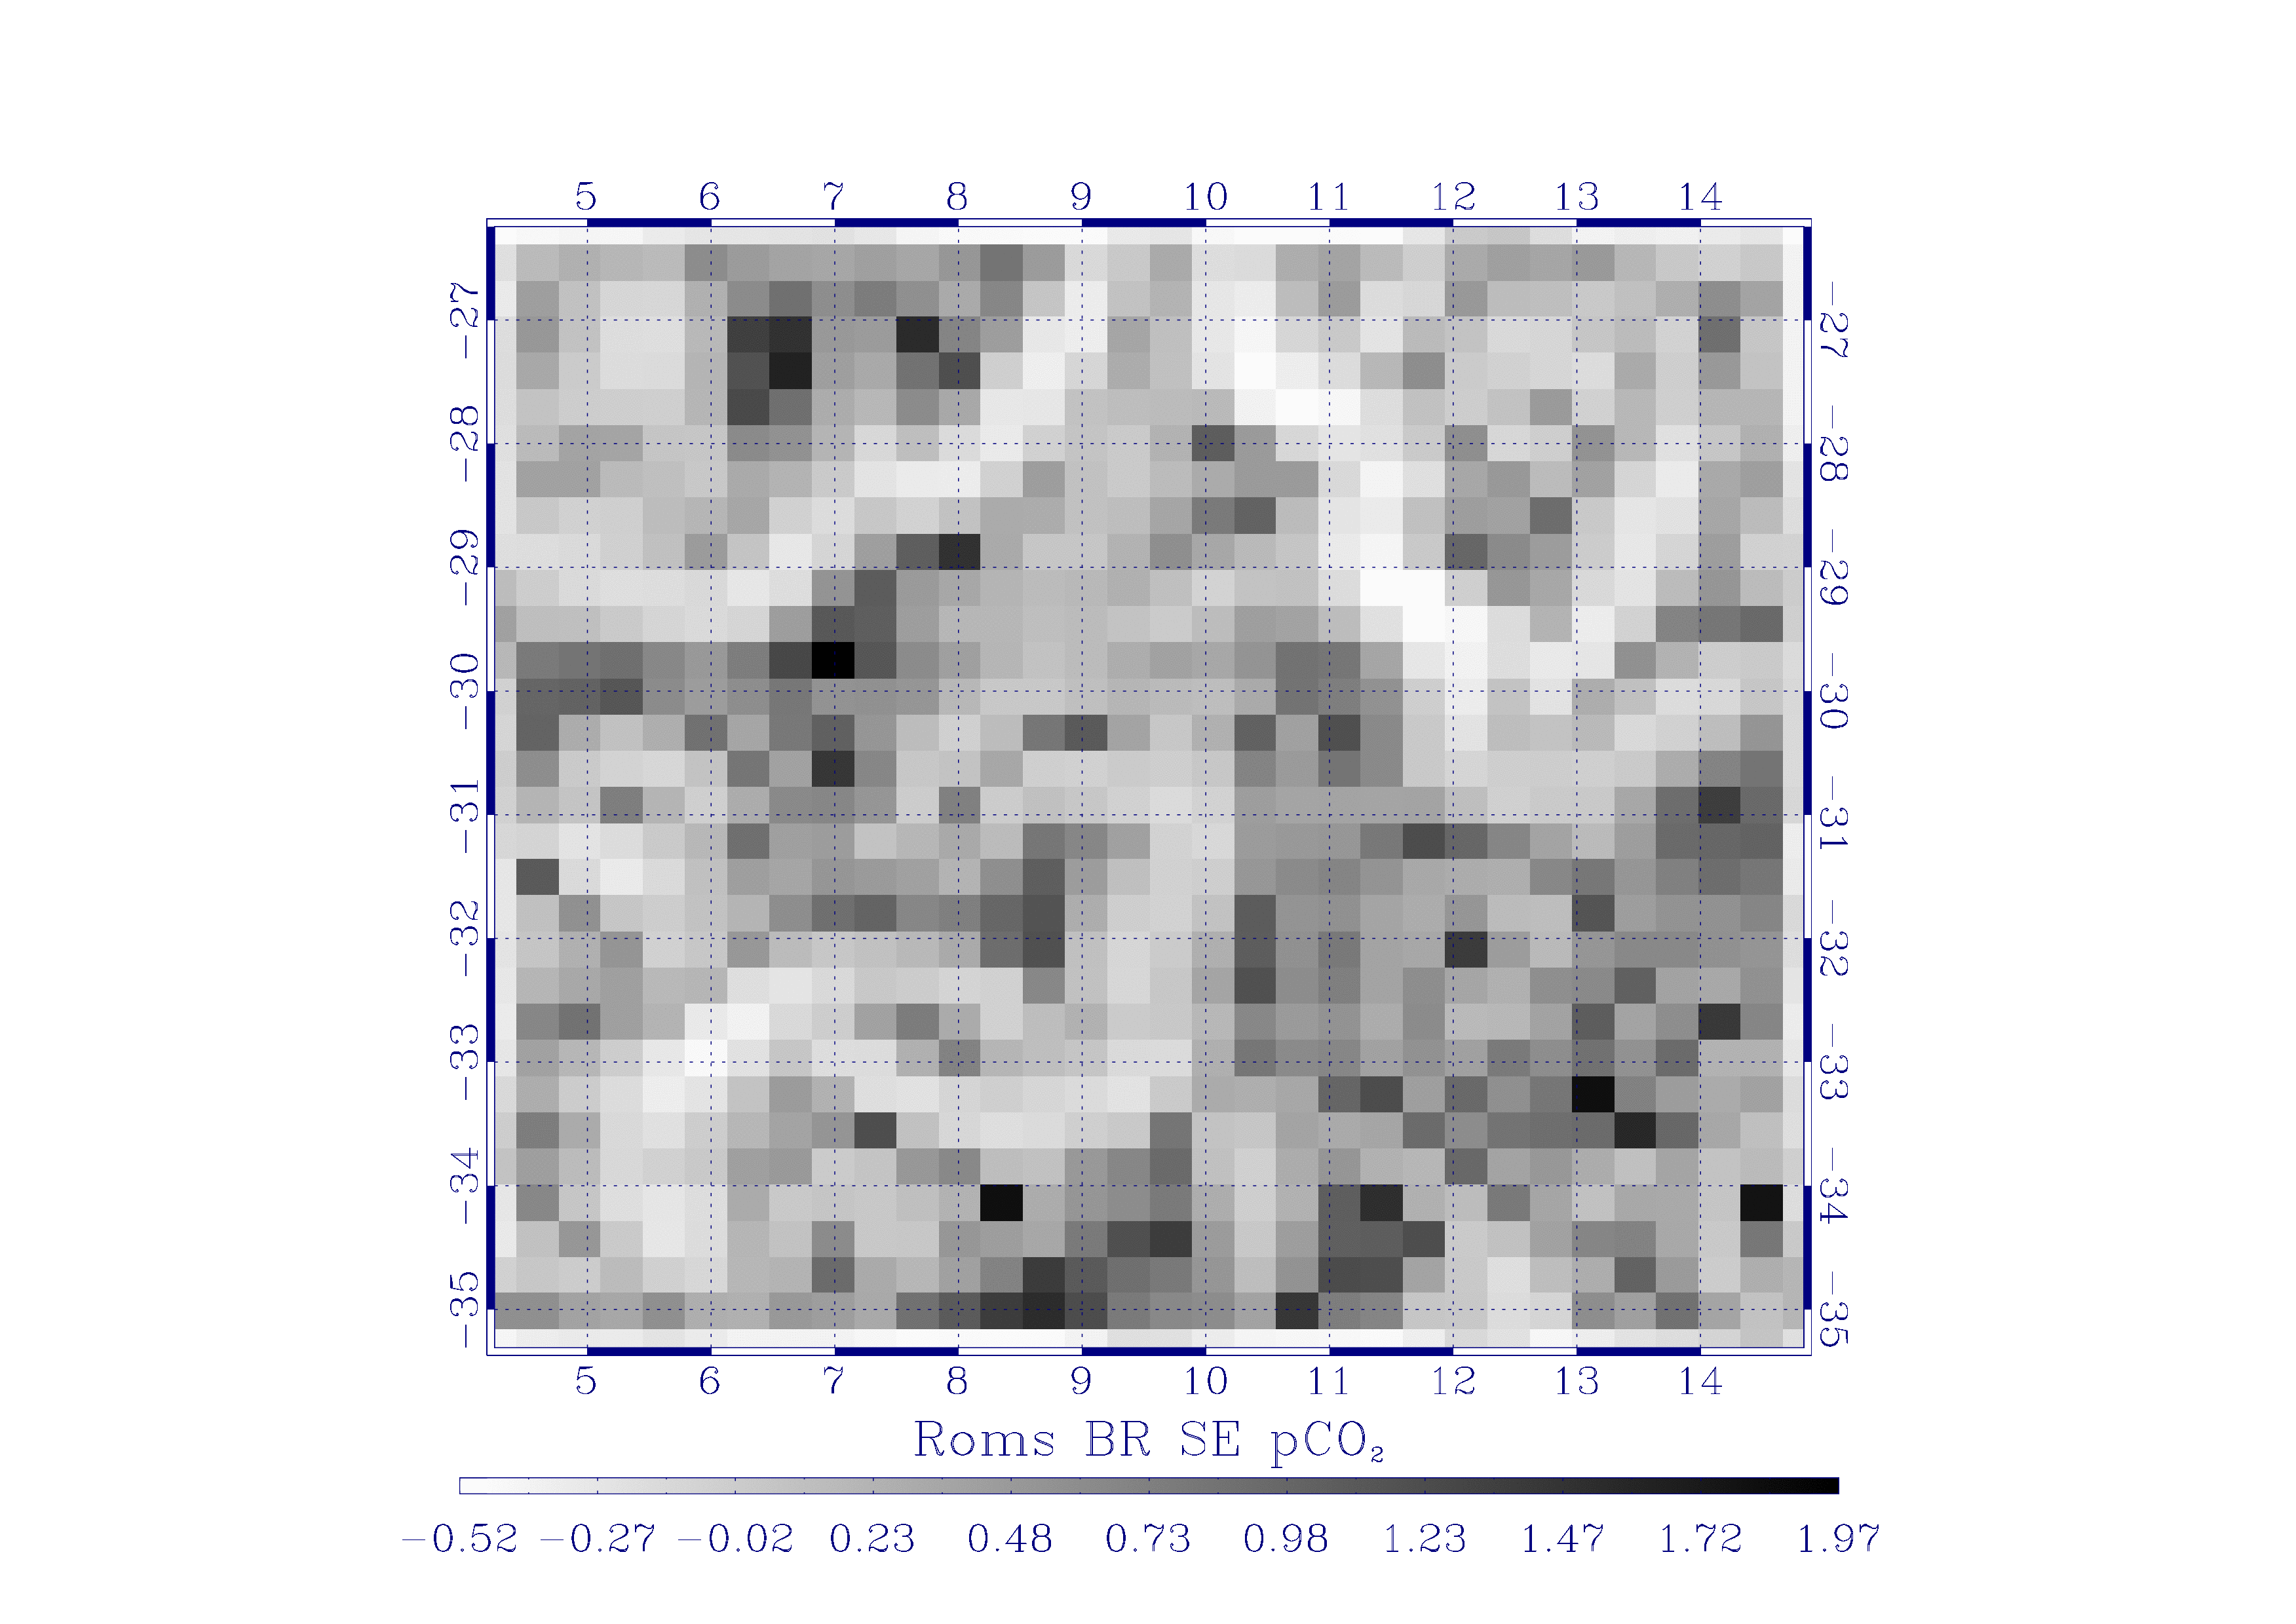
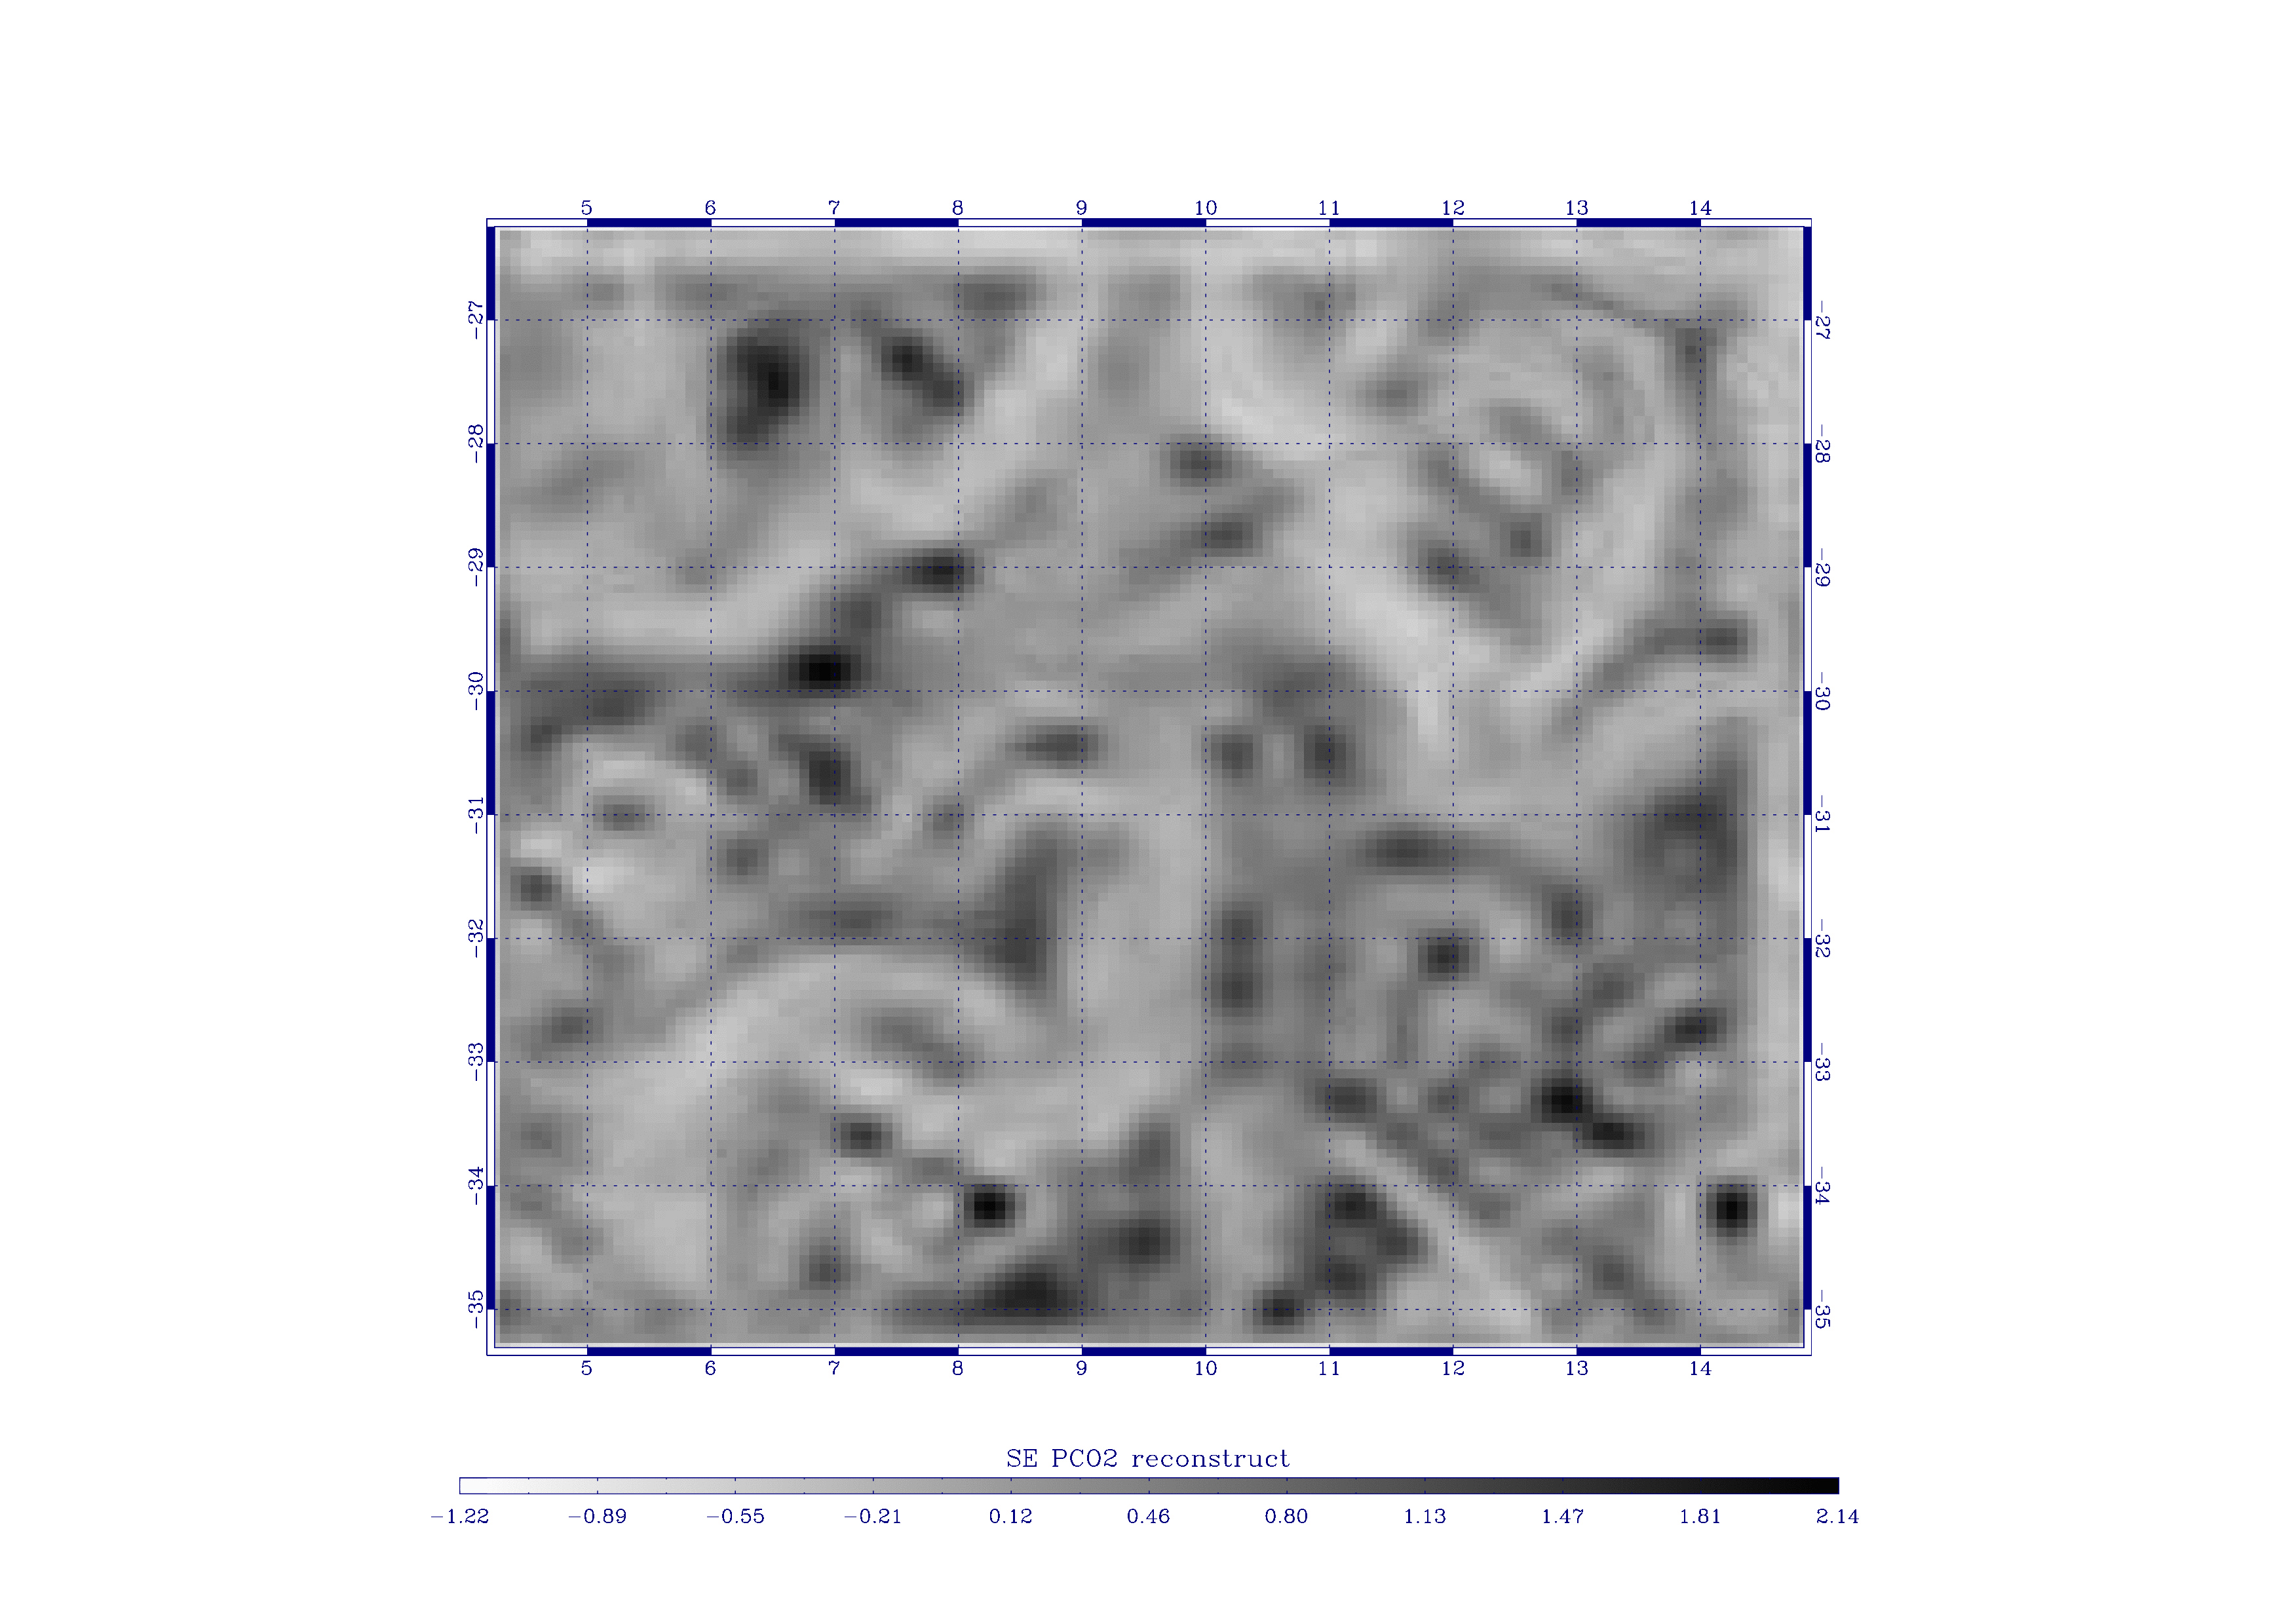
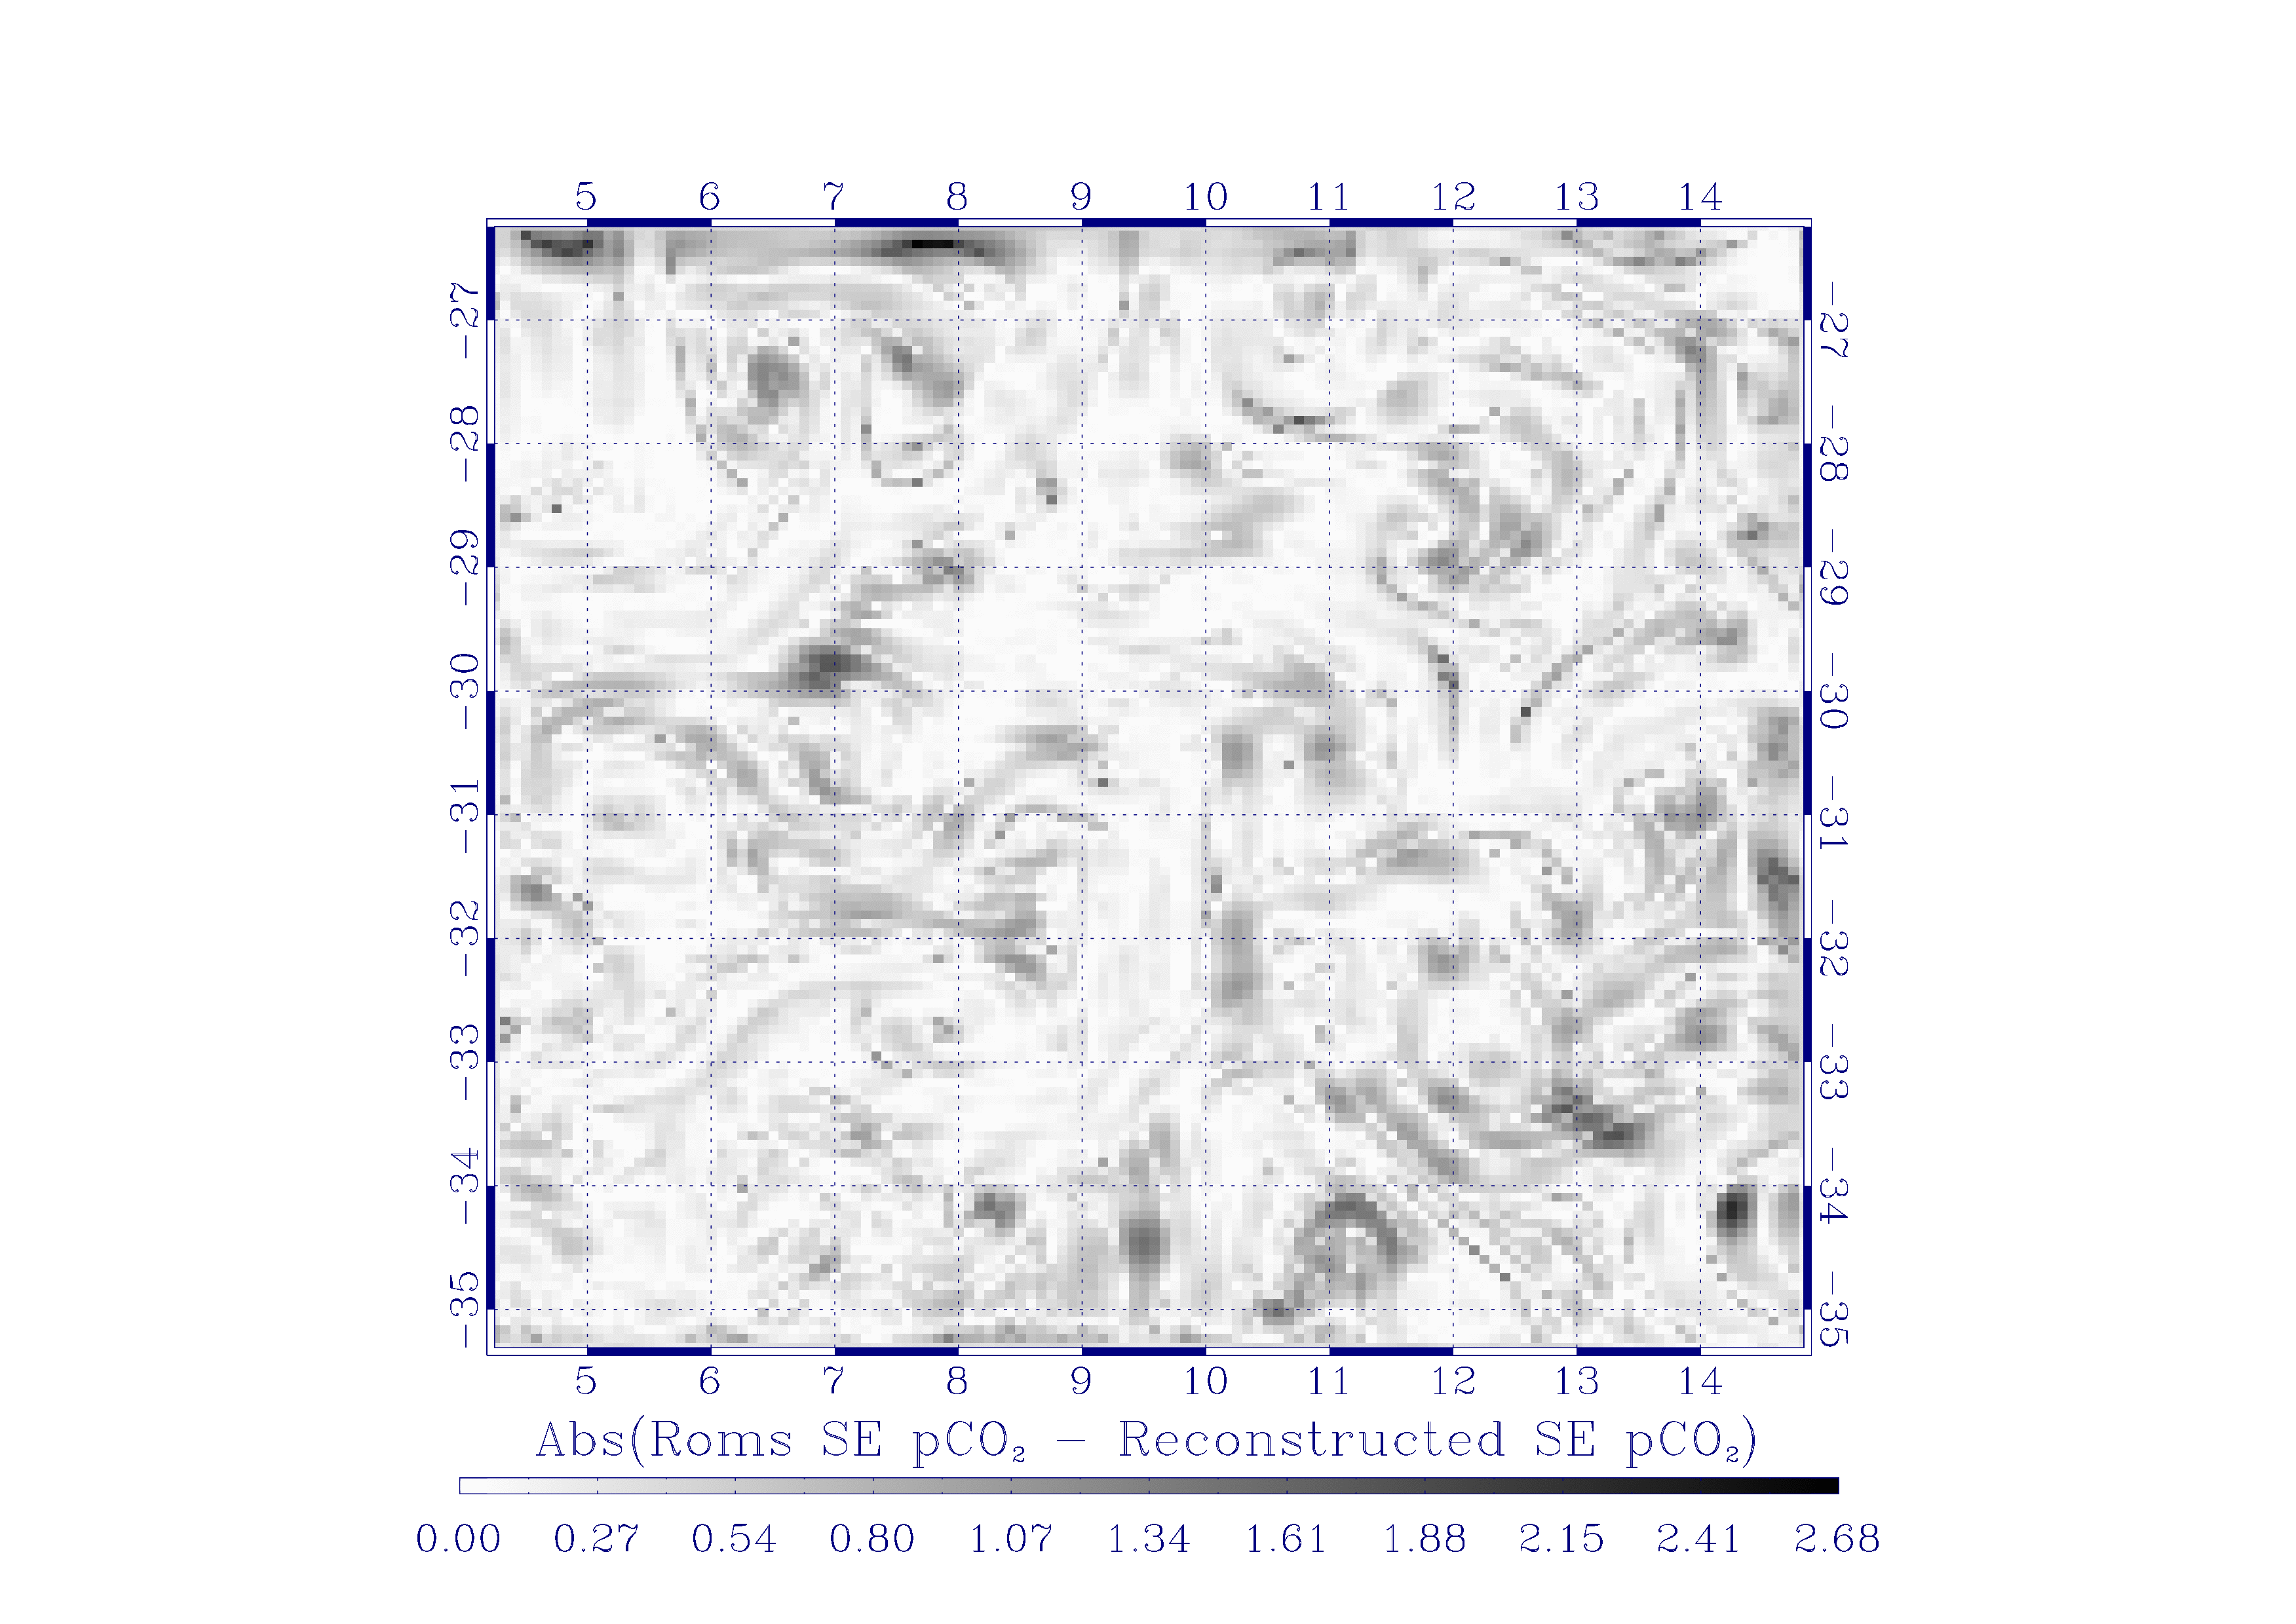
Figure
6. Left : the low resolution version of LPEs for . Middle: result of the reconstruction. Right: absolute difference map between the ROMS generated high resolution LPEs and the reconstructed. |
We prove the feasibility of a reconstruction by computing the high resolution LPEs from their low resolution counterparts and an effective multiresolution analysis, using only an approximation of the optimal wavelet in the form of a Battle-Lemarié 3-31 mother wavelet. We show in figure 6 the results obtained by inference along the scales. The reconstructed LPEs of are in good correspondence with the original high resolution signal.