

Section: Software and Platforms
GraphDice
Participants : Jean-Daniel Fekete [correspondant] , Pierre Dragicevic, Niklas Elmqvist, Anastasia Bezerianos.
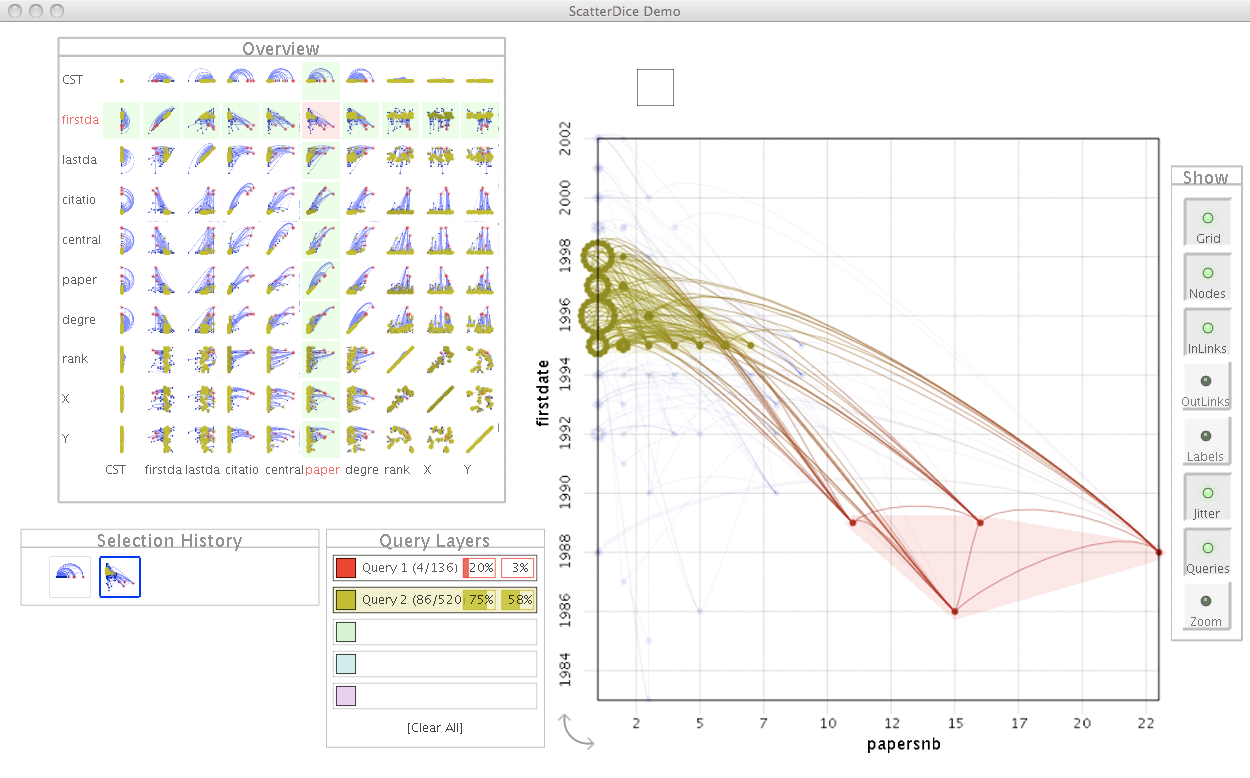
GraphDice [1] is a visualization system for exploring multivariate networks (Fig. 7 ). GraphDice builds upon our previous system ScatterDice (best paper award at the IEEE InfoVis 2008 conference) [60] : it shows a scatter plot of 2 dimensions among the multiple ones available and provides a very simple paradigm of 3D rotation to change the visualized dimensions. The navigation is controlled by a scatter plot matrix that is used as a high-level overview of the dataset as well as a control panel to switch the dimensions.
While ScatterDice works on any tabular dataset (e. g., CSV file), the GraphDice system show networks using a node-link diagram representation as a scatter plot with links drawn between connected nodes. For more information, see the web page at http://graphdice.gforge.inria.fr .