Section: New Results
Improving inference of metabolic models
Participants : David James Sherman [correspondant] , Pascal Durrens, Razanne Issa, Anna Zhukova.
The Pantograph approach uses an annotated “scaffold” (reference) model and a collection of complementary predictions of homology between scaffold genes and target genes. The basis of the method is a weighing of the homology evidence to decide whether a reaction that is present in the scaffold ought be be present in the target.
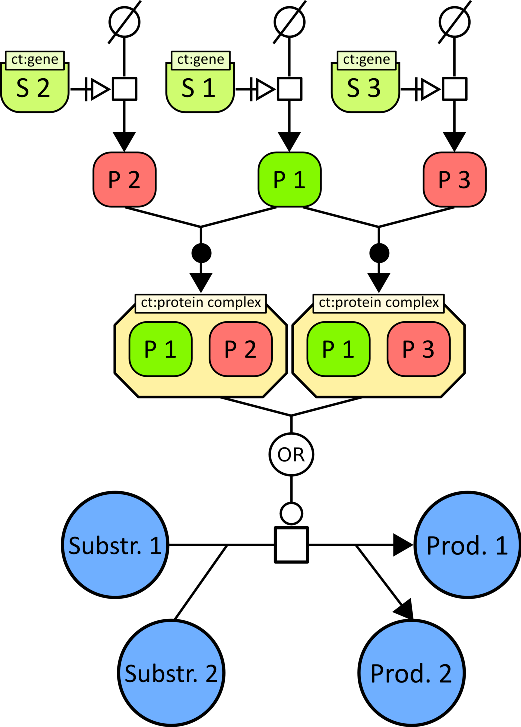
We have improved on the method in two ways. First, we model the implicit knowledge represented in the boolean formula of each gene association, to derive hypotheses about the explicit role of individual genes; for example, a gene association may implicitly represent an enzyme complex formed from two subunits, the first encoded by gene , and the second encoded by two paralogous genes and (figure 2 ). By using these hypotheses to rewrite gene associations, we improve the decision of whether a reaction is present in the target or not.
Second, we have adopted an abductive strategy for inferring reactions. In this strategy we consider that it is the reactions that explain the genes observed in the target genome. In the corresponding abductive logic program, the observations are the genes in the target, the integrity constraints are the rules that rewrite gene associations, and the hypotheses to be abduced are the reactions in the model. The scaffold model is compiled into a set of facts and predicates that express the reactions, their gene associations, and the integrity constraint rules; the abducibles generate assertions that specific reactions are in the target model. Combined with the facts of the genes observed in the target, this program generates, through abduction, the set of target reactions that explain the greatest number of genes.
The advantage of this approach is that it can invent, through specialization, reactions that are not present per se in the scaffold model.


