

Section: New Results
2D harmonic filtering of MR phase images in multicenter clinical setting: towards a magnetic signature of cerebral microbleeds
Participants : Takoua Kaaouana [correspondant] , Ludovic de Rochefort, Thomas Samaille, Nathalie Thiery, Carole Dufouil, Christine Delmaire, Didier Dormont, Marie Chupin.
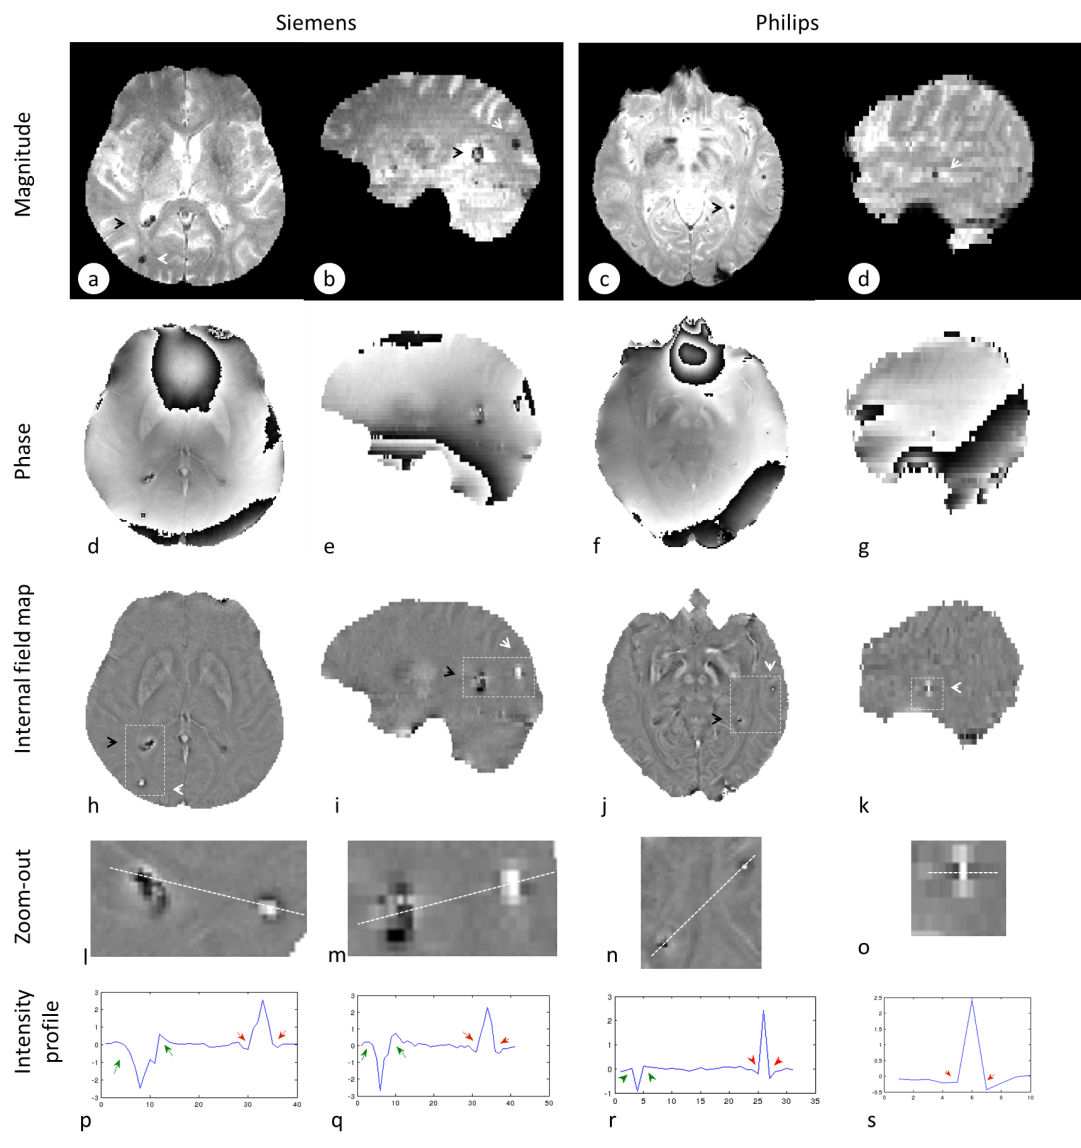
Cerebral microbleeds (CMBs) have emerged as a new imaging marker of small vessel disease. Composed of hemosiderin, CMBs are paramagnetic and can be detected with MRI sequences sensitive to magnetic susceptibility (typically, gradient recalled echo T2* weighted images). Nevertheless, their identification remains challenging on T2* magnitude images because of confounding structures and lesions. In this context, T2* phase image may play a key role in better characterizing CMBs because of its direct relationship with local magnetic field variations due to magnetic susceptibility difference. To address this issue, susceptibility-based imaging techniques were proposed, such as Susceptibility Weighted Imaging (SWI) and Quantitative Susceptibility Mapping (QSM). But these techniques have not yet been validated for 2D clinical data in multicenter settings. Here, we introduce 2DHF, a fast 2D phase processing technique embedding both unwrapping and harmonic filtering designed for data acquired in 2D, even with slice-to-slice inconsistencies. This method results in internal field maps which reveal local field details due to magnetic inhomogeneity within the region of interest only. This technique is based on the physical properties of the induced magnetic field and should yield consistent results. A synthetic phantom was created for numerical simulations. It simulates paramagnetic and diamagnetic lesions within a "brain-like' tissue, within a background. The method was evaluated on both this synthetic phantom and multicenter 2D datasets acquired in a standardized clinical setting, and compared with two state-of-the-art methods. It proved to yield consistent results on synthetic images and to be applicable and robust on patient data. As a proof-of-concept, we finally illustrate that it is possible to find a magnetic signature of CMBs and CMCs on internal field maps generated with 2DHF on 2D clinical datasets that gives consistent results with CT-scans in a subsample of 10 subjects acquired with both modalities. See Fig. 6
|
More details in [16] .