

Section: New Software and Platforms
GraphDiaries
Participants : Benjamin Bach [correspondant] , Emmanuel Pietriga, Jean-Daniel Fekete.
|
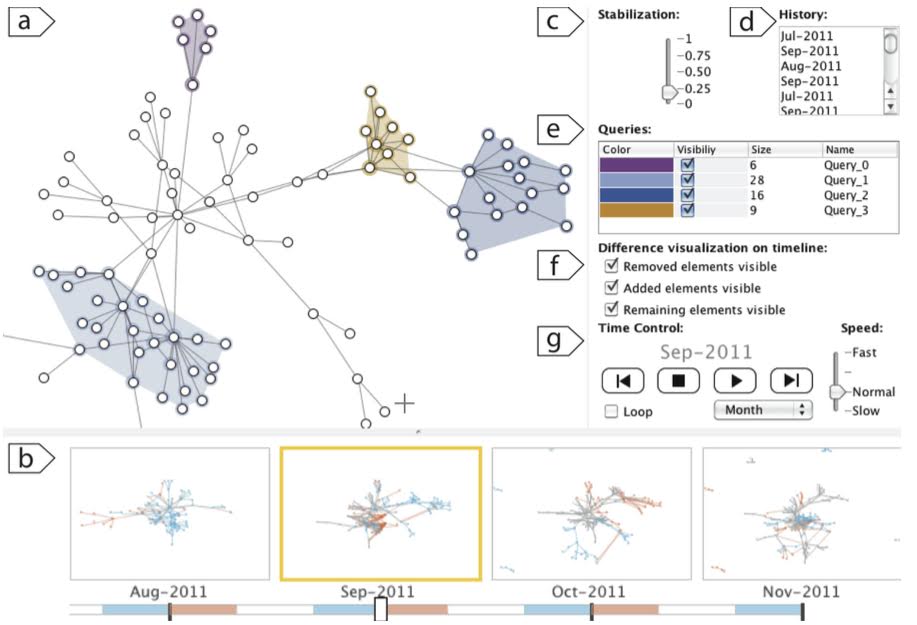
Identifying, tracking and understanding changes in networks that change over time, such as social networks, brain connectivy or migration flows, are complex and cognitively demanding tasks. To better understand the tasks related to the exploration of these networks, we introduced a task taxonomy which informed the design of GraphDiaries, [13] , a new visual interface (Figure 4 ) designed to improve support for these tasks. GraphDiaries relies on animated transitions that highlight changes in the network between time steps, thus helping users identify and understand changes. GraphDiaries features interaction techniques to quickly navigate between individual time steps of the network. We conducted on a user study, based on representative tasks identified through the taxonomy, that compares GraphDiaries to existing techniques for temporal navigation in dynamic networks, showing that it outperforms them both in terms of task time and errors for several of these tasks.