Section:
Research Program
Innovation
Figure
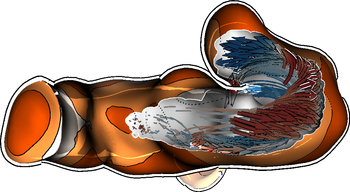
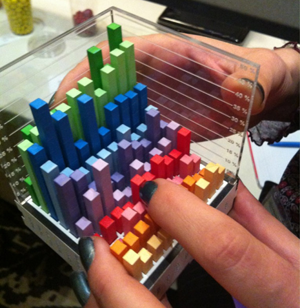
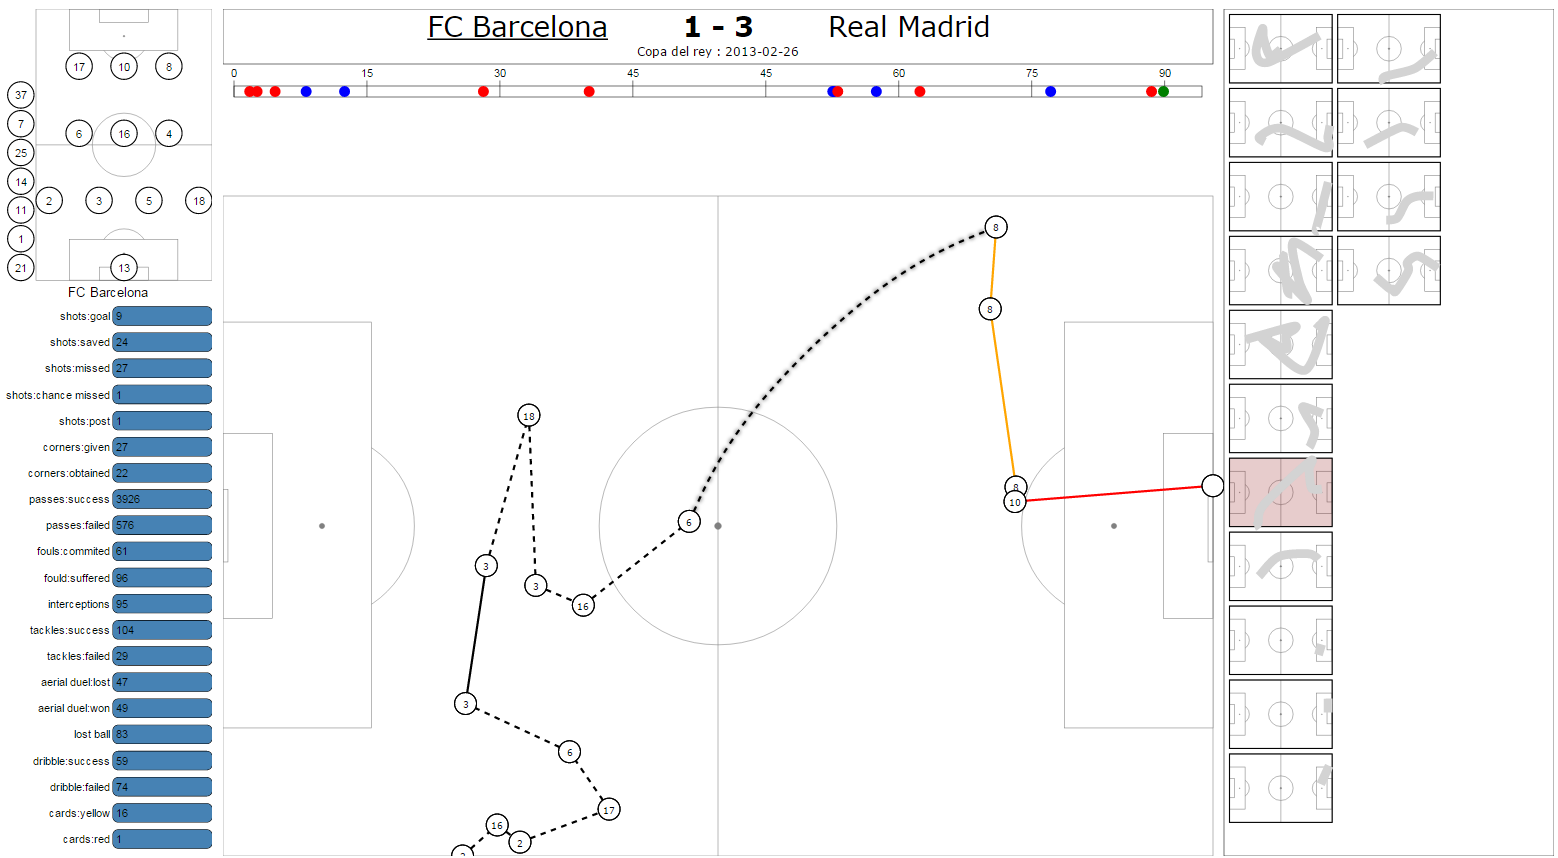
1. Example novel visualization techniques and tools developed by the team. Left: a non-photorealistic rendering technique that visualizes blood flow and vessel thickness. Middle:a physical visualization showing economic indicators for several countries, right: SoccerStories a tool for visualizing soccer games.
|
|
We design novel visualization and interaction techniques (see, for example, Figure 1). Many of these techniques are also evaluated throughout the course of their respective research projects. We cover application domains such as sports analysis, digital humanities, fluid simulations, and biology. A focus of Aviz' work is the improvement of graph visualization and interaction with graphs. We further develop individual techniques for the design of tabular visualizations and different types of data charts. Another focus is the use of animation as a transition aid between different views of the data. We are also interested in applying techniques from illustrative visualization to visual representations and applications in information visualization as well as scientific visualization.