

Section: New Results
Conceptual and Methodological Issues in Evaluating Multidimensional Visualizations for Decision Support.
Participants : Evanthia Dimara [correspondant] , Pierre Dragicevic, Anastasia Bezerianos.
|
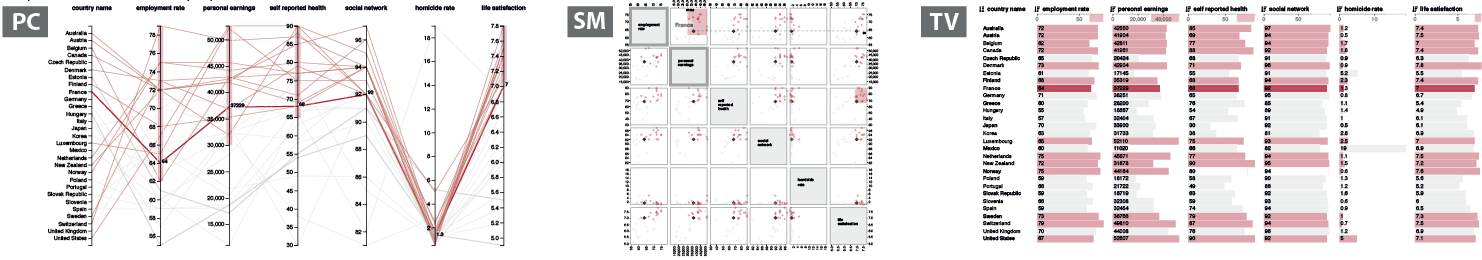
We explore how to rigorously evaluate multidimensional visualizations for their ability to support decision making. We first define multi-attribute choice tasks, a type of decision task commonly performed with such visualizations. We then identify which of the existing multidimensional visualizations are compatible with such tasks, and set out to evaluate three elementary visualizations: parallel coordinates, scatterplot matrices and tabular visualizations. Our method consists in first giving participants low-level analytic tasks, in order to ensure that they properly understood the visualizations and their interactions. Participants are then given multi-attribute choice tasks consisting of choosing holiday packages. We assess decision support through multiple objective and subjective metrics, including a decision accuracy metric based on the consistency between the choice made and self-reported preferences for attributes. We found the three visualizations to be comparable on most metrics, with a slight advantage for tabular visualizations. In particular, tabular visualizations allow participants to reach decisions faster. Thus, although decision time is typically not central in assessing decision support, it can be used as a tie-breaker when visualizations achieve similar decision accuracy. Our results also suggest that indirect methods for assessing choice confidence may allow to better distinguish between visualizations than direct ones. We finally discuss the limitations of our methods and directions for future work, such as the need for more sensitive metrics of decision support.
More on the project Web page: http://www.aviz.fr/dm.