Section: New Results
Reducing the number of samples in spatiotemporal dMRI acquisition design
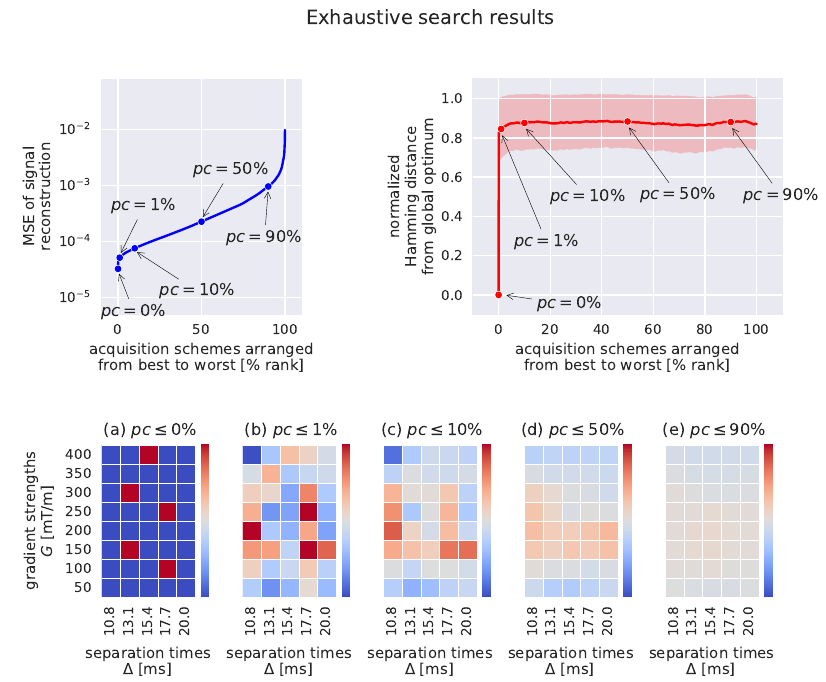
Acquisition time is a major limitation in recovering brain white matter microstructure with diffusion magnetic resonance imaging. The aim of this work is to bridge the gap between growing demands on spatio-temporal resolution of diffusion signal and the real-world time limitations. We introduce an acquisition scheme that reduces the number of samples under adjustable quality loss. Finding a sampling scheme that maximizes signal quality and satisfies given time constraints is NP-hard. Therefore, a heuristic method based on genetic algorithm is proposed in order to find sub-optimal solutions in acceptable time. The analyzed diffusion signal representation is defined in the qτ space, so that it captures both spacial and temporal phenomena. The experiments on synthetic data and in vivo diffusion images of the C57Bl6 wild-type mouse corpus callosum reveal the superiority of the proposed approach over random sampling and even distribution in the qτ space. The use of genetic algorithm allows to find acquisition parameters that guarantee high signal reconstruction accuracy under given time constraints. In practice, the proposed approach helps to accelerate the acquisition for the use of q-dMRI signal representation.
|
More information can be found in [12]


