Section:
New Results
Multivariate Network Visualization
Figure
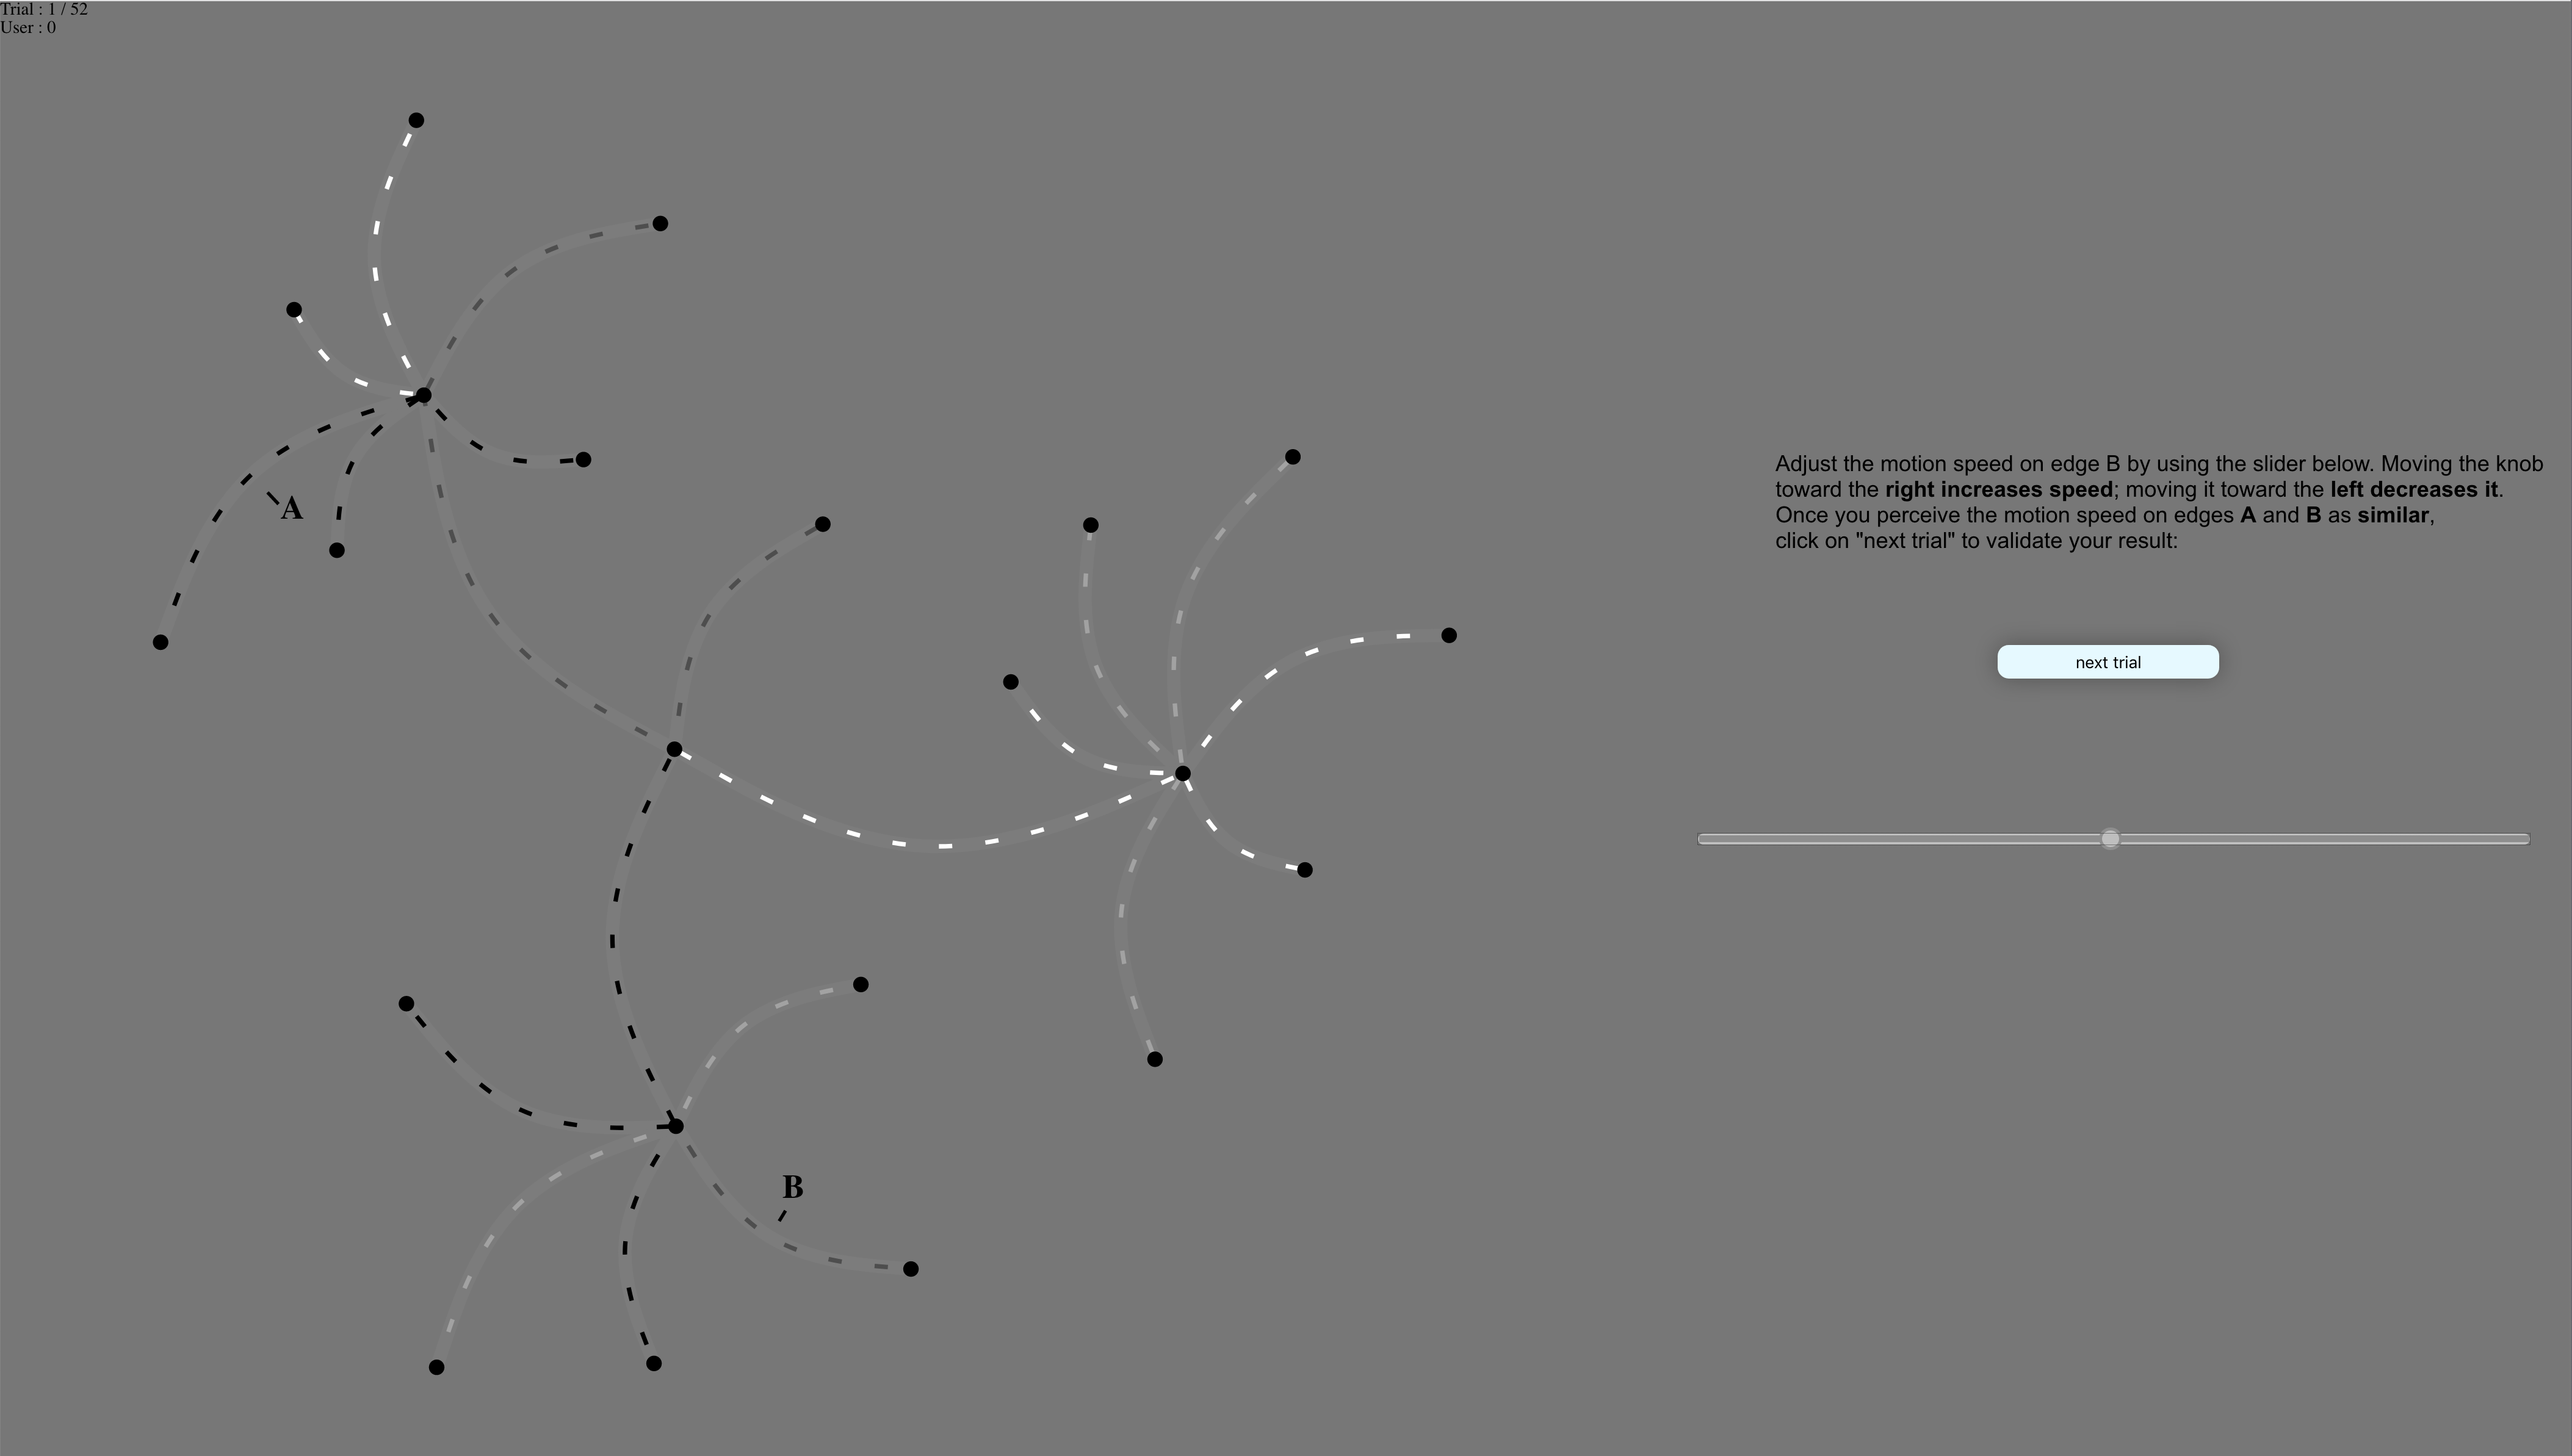
5. Experimental task used in the study about the influence of color and size of moving particles on their perceived speed in node-link diagrams. Participants had to adjust the speed of particles on a specific edge so that it would match that of particles on another edge, using a slider.
|
|
Edges in networks often represent transfer relationships between vertices. When visualizing such networks as node-link diagrams, animated particles flowing along the links can effectively convey this notion of transfer. Variables that govern the motion of particles, their speed in particular, may be used to visually represent edge data attributes. Few guidelines exist to inform the design of these particle-based network visualizations, however. Following up on our initial investigation of motion as an encoding channel for edge attributes in multivariate network visualization [75], we investigated the influence of color and size of moving particles on their perceived speed in node-link diagrams (INTERACT 2019 [20]). Empirical studies so far had only looked at the different motion variables in isolation, independently from other visual variables controlling the appearance of particles, such as their color or size. We ran a study of the influence of several visual variables on users' perception of the speed of particles. Part of the experimental setup is illustrated in Figure 5. Our results show that particles' luminance, chromaticity and width do not interfere with their perceived speed. But variations in their length make it more difficult for users to compare the relative speed of particles across edges.
Figure
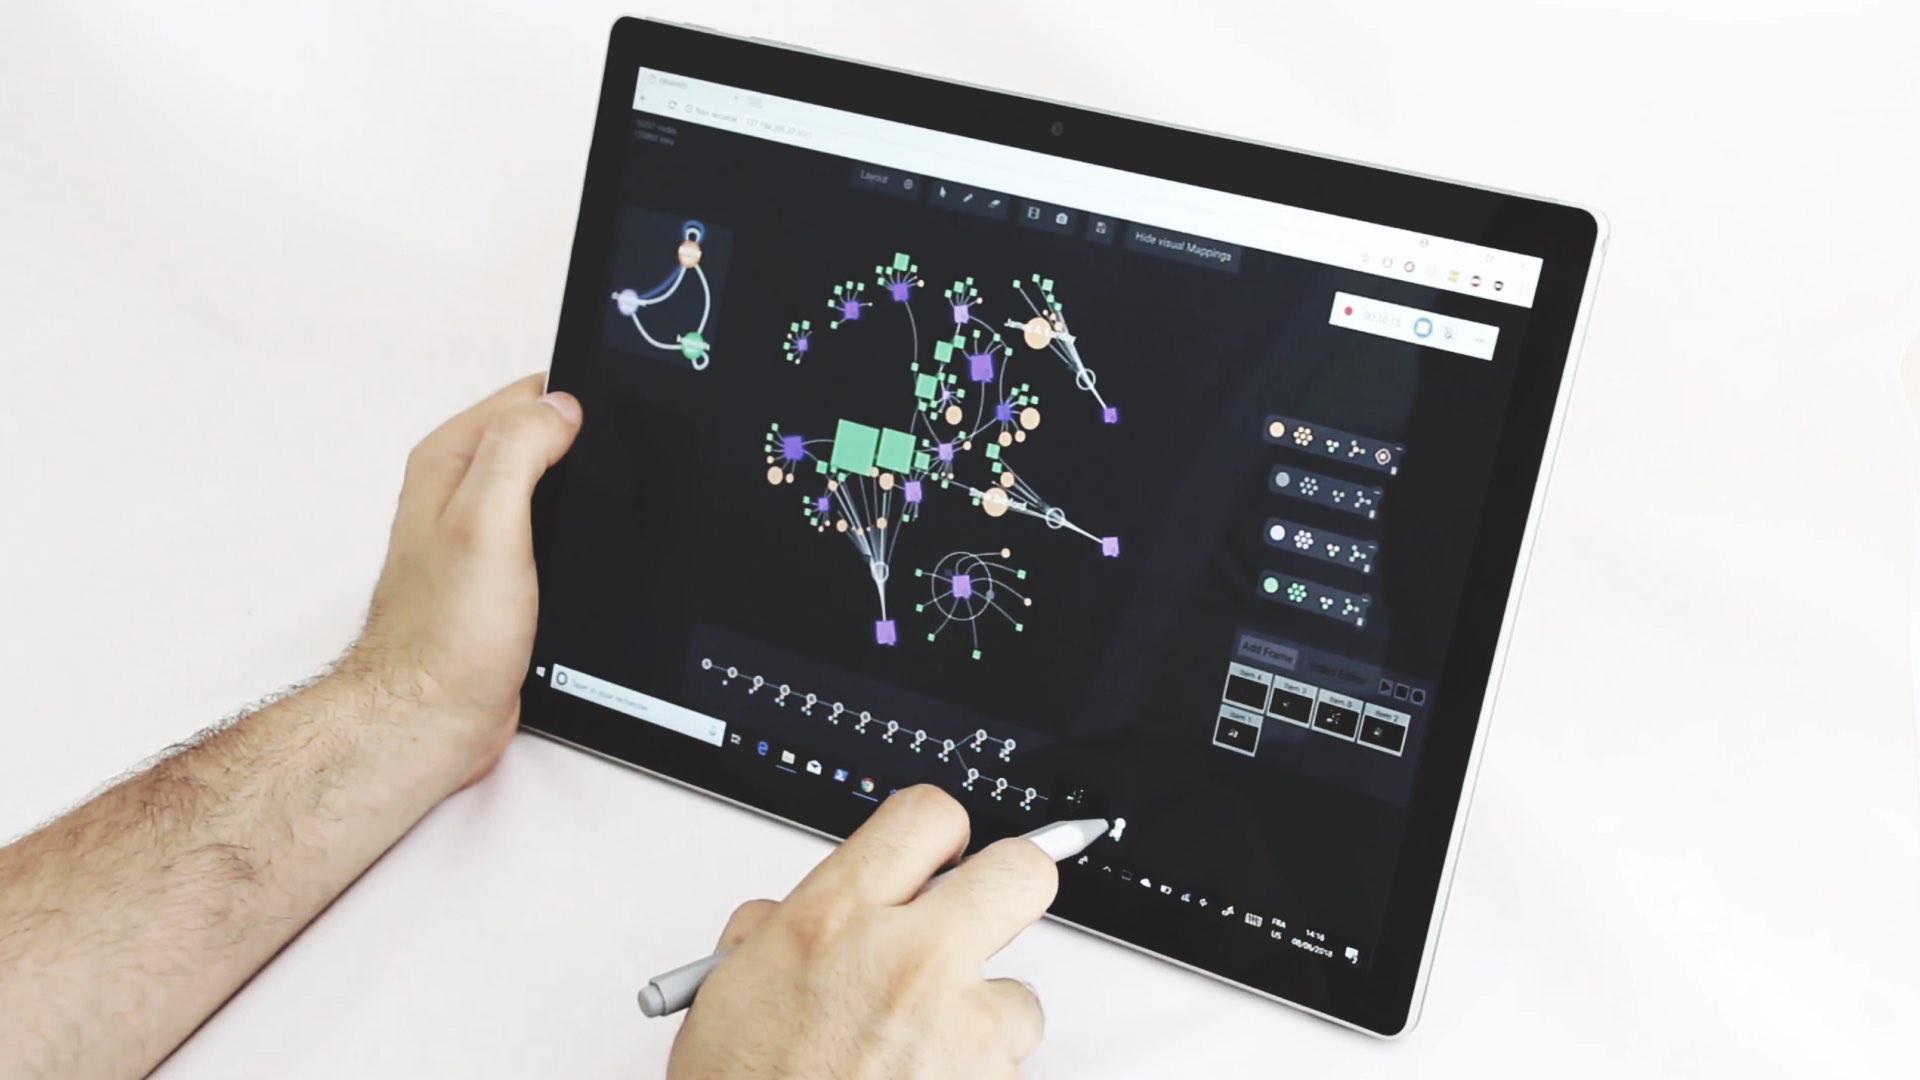
6. Graphies running on a tablet with support for pen+touch. Graphies is developed entirely using Web technologies.
|
|
Beyond questions of perception of information in multivariate network visualizations, we also investigated the problem of creating environments for the design of multivariate network visualizations, with a focus on expressive design. Expressive design environments enable visualization designers not only to specify chart types and visual mappings, but also to customize individual graphical marks, as they would in a vector graphics drawing tool. Prior work had mainly investigated how to support the expressive design of a wide range of charts generated from tabular data: bar charts, scatterplots, maps, etc. But multivariate network data structures raise specific challenges and opportunities in terms of visual design and interactive authoring. Together with company TKM (see Section 8.1), we developed an expressive design environment for node-link diagrams generated from multivariate networks called Graphies (TVCG 2019, [15]), illustrated in Figure 6. We followed a user-centered design approach, involving expert analysts from TKM, and validated the approach through a study in which participants successfully reproduced several expressive designs, and created their own designs as well.