

Section: New Results
Immersive and interactive visualization of 3D temporal data using a space time hypercube
Participants : Gwendal Fouché, Charles Kervrann.
|
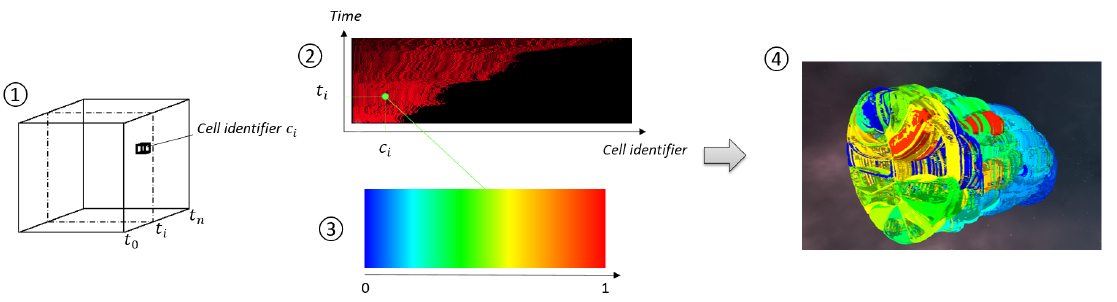
The analysis of multidimensional time-varying datasets, whose size grows as recording and simulating techniques advance, faces challenges on the representation and visualization of dense data, as well as on the study of temporal variations. In this context, we proposed an extension of the well-known Space-Time Cube (STC) visualization technique in order to visualize time-varying 3D spatial data acquired in 3D fluorescence microscopy, taking advantage of the interaction capabilities of Virtual Reality. The extended STC is based on a user-driven projection of the spatial and temporal information modeled as a 4D Space-Time Hypercube (STH). This projection yields a 3D STC visualization, which can also encode non-spatial quantitative data. Moreover, we proposed a set of tools allowing the user to manipulate the 3D STC that benefits from the visualization, exploration and interaction possibilities offered by immersive environments (see Figure 10). Finally, the extended STC has been integrated in a VR application for visualization of spatiotemporal biological data, illustrating the usage of the proposed visualization method for the morphogenesis analysis.
Collaborators: F. Argelaguet (EPC hybrid , Inria Rennes),
E. Faure (Laboratory of Computer Science, Robotics and Microelectronics of Montpellier).