

Section: New Results
Visual Analytics of EA Data
Participants : Jean-Daniel Fekete, Évelyne Lutton [correspondant] .
|
An experimental analysis of Evolutionary Algorithms (EAs) usually generates a huge amount of multidimensional data, including numeric and symbolic data. It is difficult to efficiently navigate in such a set of data, for instance to be able to tune the parameters or evaluate the efficiency of some operators. Usual features of existing EA visualisation systems consist in visualising time- or generation-dependent curves (fitness, diversity, or other statistics). When dealing with genomic information, the task becomes even more difficult, as a convenient visualisation strongly depends on the considered fitness landscape. In this latter case the raw data are usually sets of successive populations of points of a complex multidimensional space.
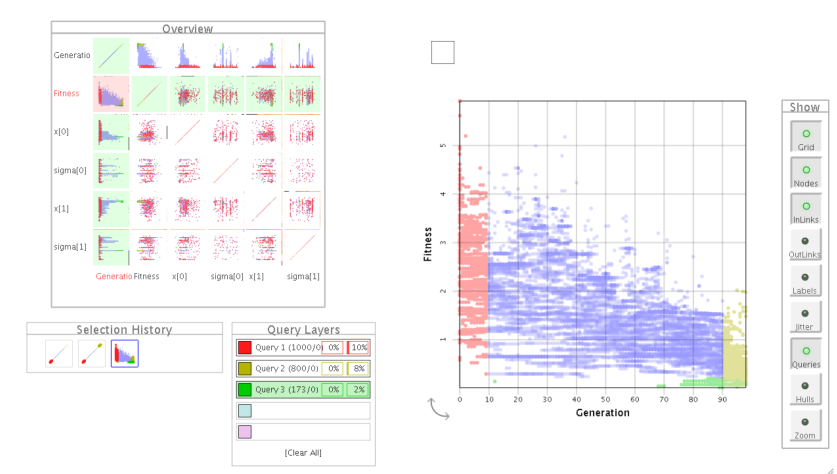
The purpose of this study was to evaluate GraphDice on complex sets of EA data (for artificial and real test-cases), and to sketch future developements of this tool, in order to better adapt it to the needs of EA experimental analysis (Fig. 6 ). An output of this study is the acceptation of the EASEA-Cloud ANR-Emergence project, in which developements will aim at adding tools in GraphDice specific for: