Section: New Results
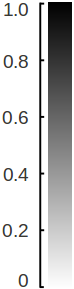
Dynamic World Perception and Evolution Prediction
Environment modeling and sensor data acquisition
Participants : Igor Paromtchik, Christian Laugier, Mathias Perrollaz, Amaury Nègre, John-David Yoder.
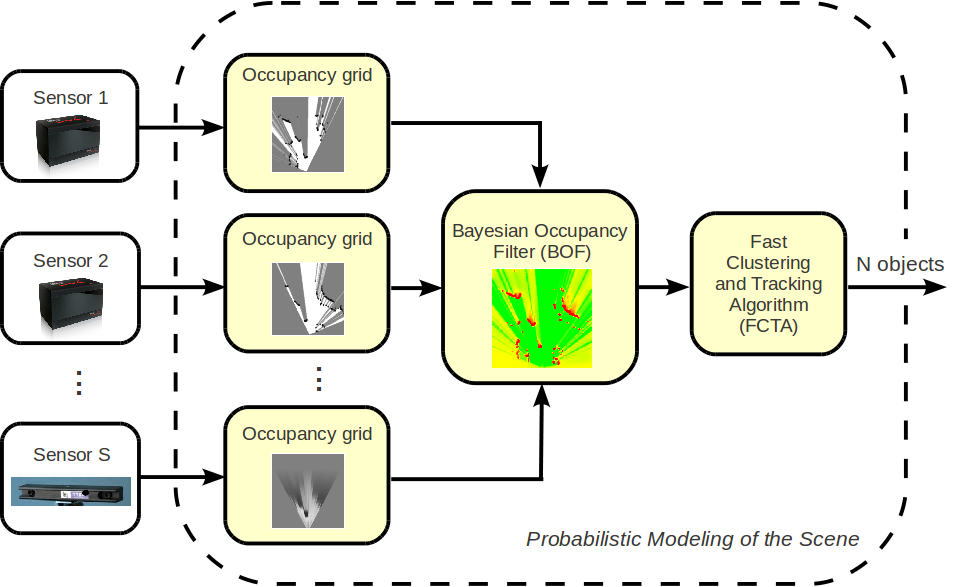
An overall architecture of our environment-modeling module with the inputs from heterogenous sensors is shown in Fig. 6 . The combined use of two lidars and stereo-vision helps mitigate uncertainty and allows for detection of partially occluded objects. The data processing includes the computation of probabilistic occupancy grids for each sensor and their subsequent fusion with the Bayesian Occupancy Filter (BOF). The output of the module is an estimation of the position, velocity and associated uncertainty of each observed object, which are used as input to the risk assessment module.
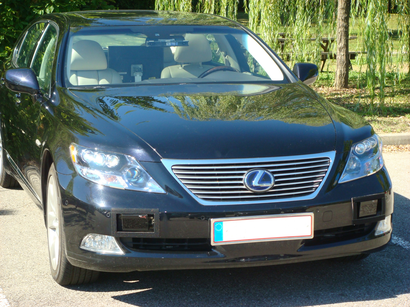
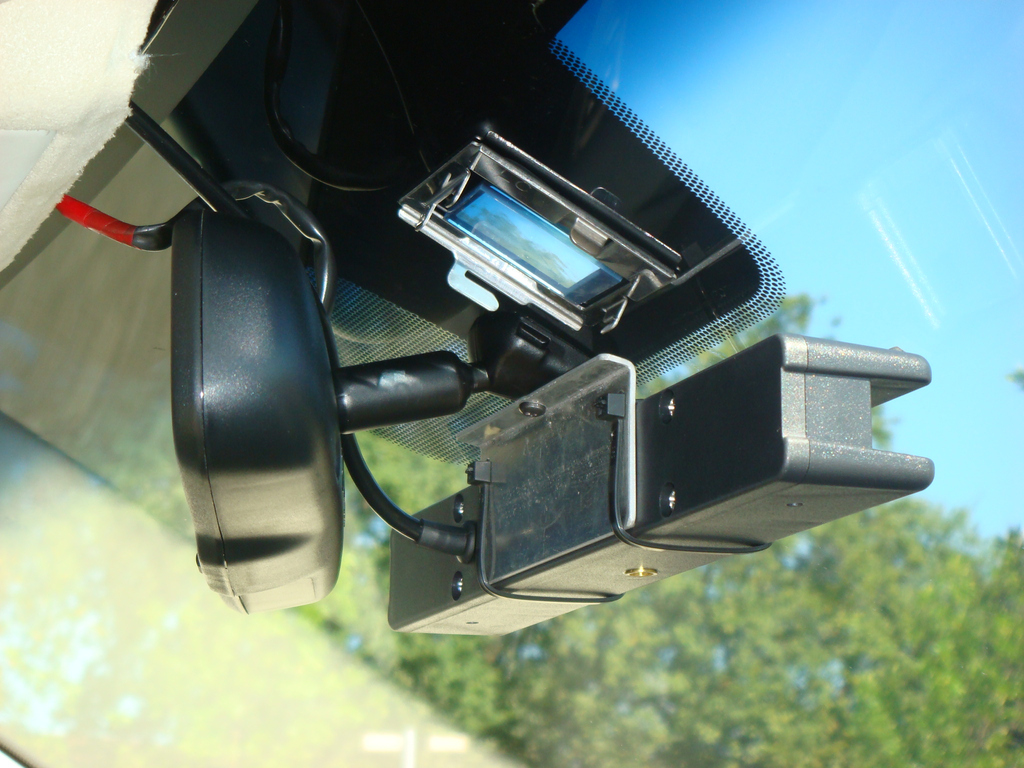
This architecture is implemented on our experimental platform, a Lexus LS600h car shown in Fig. 7 . The vehicle is equipped with a variety of sensors including two IBEO Lux lidars placed toward the edges of the front bumper, a TYZX stereo camera situated behind the windshield, and an Xsens MTi-G inertial sensor with GPS.
|
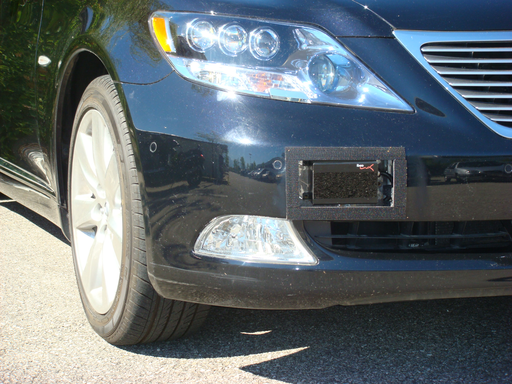
The stereo camera baseline is 22 , with a field of view of . Camera resolution is 512x320 pixels with a focal length of 410 pixels. Each lidar provides four layers of up to 200 impacts with a sampling period of 20 . The angular range is 100, and the angular resolution is 0.5. The on-board computer is equipped with 8GB of RAM, an Intel Xeon 3.4 processor and an NVIDIA GeForce GTX 480 for GPU. The observed region is 40 long by 40 wide, with a maximum height of 2 . Cell size of the occupancy grids is 0.2x0.2 .
The Lexus experimental platform provides to acquire sensor data in real traffic environments: eight layers of laser scans, stereo images, IMU data (accelerations), velocity, GPS position, steering angle. The experiments are conducted in various road environements (country roads, downtown and highway), at different time of the day, with various driving situations (light traffic, dense traffic, traffic jams). The datasets are acquired online and are used for testing of our sensor fusion and risk assessment algorithms.
Bayesian fusion of visual and telemetric information
Participants : Igor Paromtchik, Christian Laugier, Mathias Perrollaz, Amaury Nègre.
Concept of BOF and obstacle detection in occupancy grids
Obstacle detection is a widely explored domain of mobile robotics. It presents a particular interest for the intelligent vehicle community, as it is an essential building block for Advanced Driver Assistance Systems (ADAS). In the ANR project LOVe (Logiciel d'Observation de Vulnerables) and ArosDyn project, the e-Motion team proposed to perform obstacle detection within the occupancy grid framework. In order to work efficiently with occupancy grids, we have previously developed a probabilistic framework with the Bayesian Occupancy Filter (BOF) [40] [88] (patent 0552736 (2005) ), which provides filtering, data fusion, and velocity estimation capabilities while allowing for parallel computation. The Fast Clustering and Tracking Algorithm (FCTA) [73] is then used to identify and track individual objects. The BOF is designed with the intent of its implementation in hardware as a system-on-chip. Like other grid based approaches, the BOF framework performs sensor fusion at the cell level [40] . The BOF evaluates probabilities of both cell occupancy and cell velocity for each cell in a four-dimensional spatio-temporal grid. The monitoring of traffic scenes includes detection and tracking of objects by the FCTA [73] .
Fig. 8 shows examples of occupancy grid mapping with the proposed approach. The arrows indicate the pedestrian, the car, and the bicycle, which appear in the camera images and the occupancy grids. Because the accuracy of stereo-vision tends to become poor at large distance, the corresponding grid has been attenuated beyond 20 and the system is tuned to give more confidence to the lidars than to the stereo-vision. One of advantages of sensor fusion is a larger viewfield so that the vehicles overtaking the ego-vehicle (they are not seen in the camera images) are correctly mapped on the resulting BOF grid. Moreover, the sensor fusion as well as the Bayesian estimation provide to filter out the laser impacts with the road surface, e.g. right lidar in Fig. 8 .
|
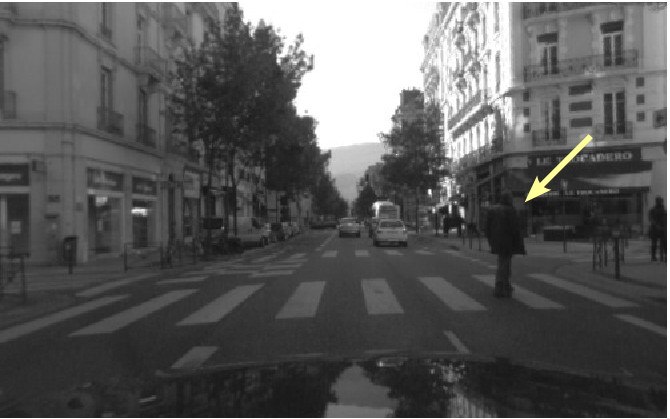
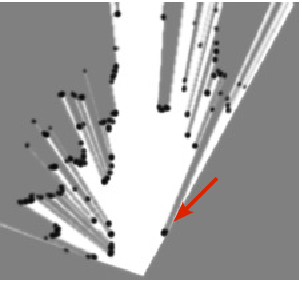
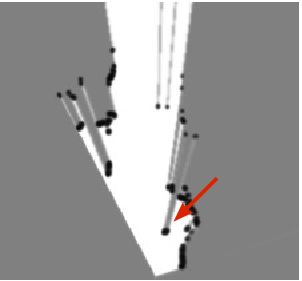
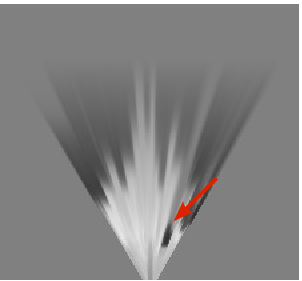
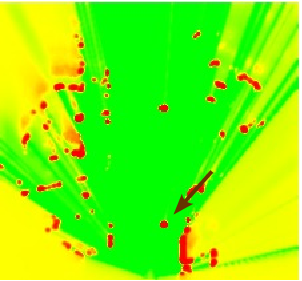
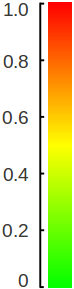
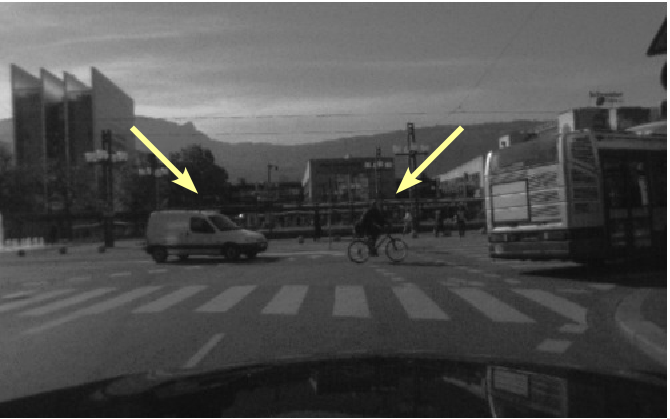
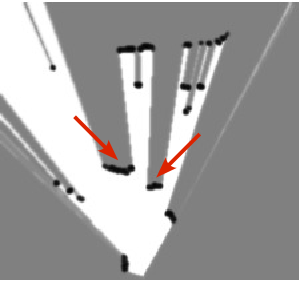
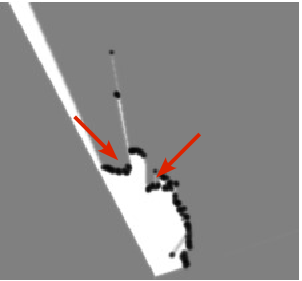
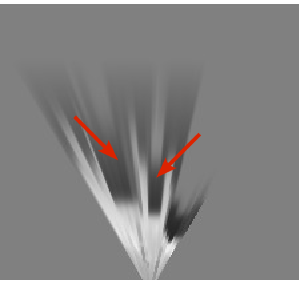
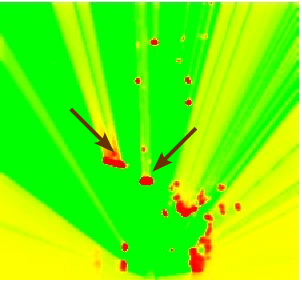
Note that a large number of dynamic objects in the traffic scenes may lead to a failure of object-based fusion because of a large number of association hypotheses. The grid-based approach allows us to avoid the object association problem for sensor fusion.
Disparity space approach for a vision based occupancy grid
Participants : Mathias Perrollaz, Anne Spalanzani, John-David Yoder, Amaury Nègre, Christian Laugier.
To use sensors in the BOF framework, it is essential to develop an associated probabilistic sensor model that takes into consideration the uncertainty over measurements. In 2009, we proposed such a sensor model for stereo-vision [79] . The originality of the approach relied on the decision to work in the disparity space, instead of the classical Cartesian space. In 2010, we improved our sensor model, in order to mimic some features of the sensor models used for range finders. Particularily, we worked on managing visible/occluded areas of the scene [81] , and on including the information from the road/obstacle segmentation of the disparity image [80] . Our approach was also designed to allows highly parralel computation of the occupancy grid. A. Nègre implemented the approach on GPU using NVIDIA CUDA to enhance the performance. The complete processing of the stereo data can now be done in 6 ms, while more than 150 ms were necessary with the CPU implementation. The complete approach for occupancy grid computation using stereovision is described in [30] .
|
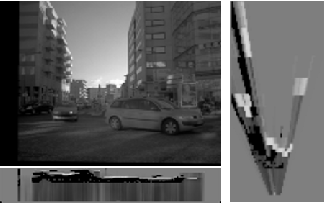
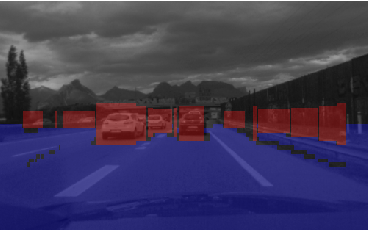
Figure 9 shows an example of the occupancy grid computed by our new approach. We can observe that most objects are detected (light color), even if partially occluded (e.g. the sign on the right). Information from the road surface is also taken into consideration (dark areas). Moreover, similar to a laser scanner, it appears that regions in front of objects are seen as partially unoccupied, while less information is available behind obstacles (occupancy probability is closer to 0.5).
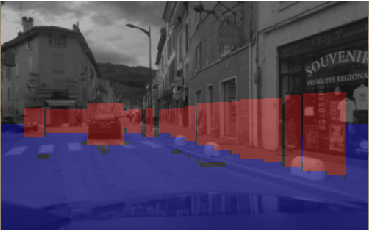
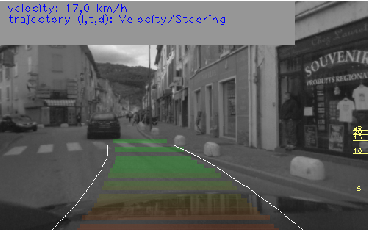
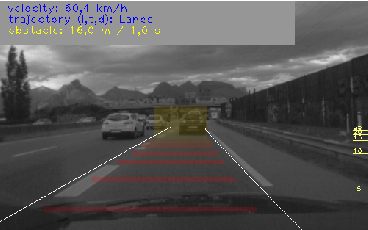
In 2011, we focused on including the approach into the risk estimation framework on our Lexus experimental platform. We implemented a demonstration to estimate a distance measurement to the closer object situated in the future trajectory of the vehicle. The future trajectory is estimated either by using a lane detection algorithm (in the highway) or by combining velocity and steering information of the vehicle. Figure 10 shows the HMI displayed in the car while driving.
|
Processing of multi-layer telemetric data in probabilistic framework
Participants : Mathias Perrollaz, Juan-David Adarve, Alexandros Makris.
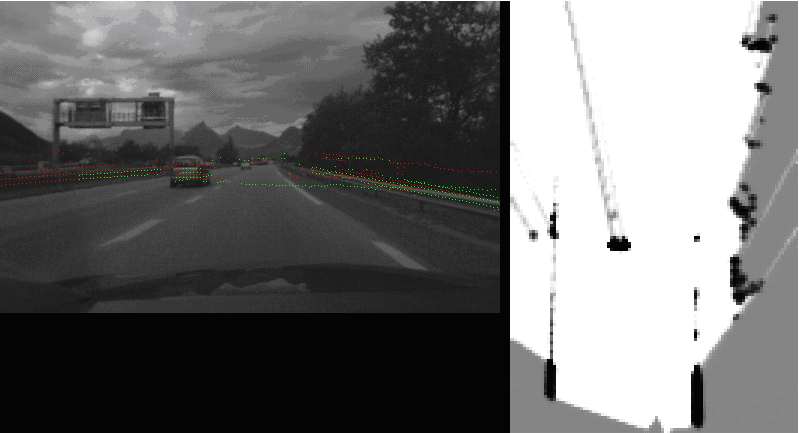
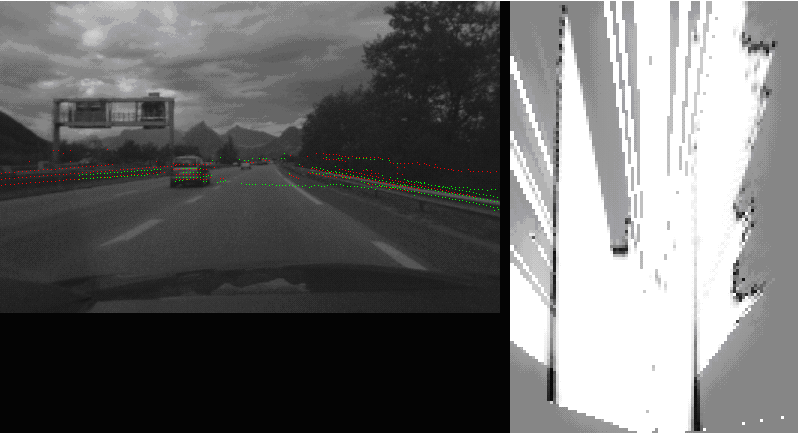
The occupancy grid computation based on a laser scanner uses the classical independent beam sensor model [90] . Since our vehicle is equipped with two four-layers laser scanners, it is necessary to merge the data from the multiple layers. In the original BOF framework, the fusion was performed through the classical Bayesian Fusion methodology. As shown in figure 11 , this method causes problems of misdetection when some beams go over an object. In 2011, we proposed and implemented another approach. The fusion is now obtained through a weighted sum of the the occupancy grids provided by each layer. The weight of each layer is obtained by computing a confidence grid. This confidence depends both on the inclination of the layer and on the possible occlusions. The new approach provides a more precise description of the environement.
|
Sensor Fusion and parameters estimation
Participants : Agostino Martinelli, Chiara Troiani.
This is the follow up of the research activity started in 2009, when a self-calibration problem for a wheeled robot has been investigated. The main results achieved during that year were published in [69] , [71] and [70] This calibration problem allows us to introduce a general framework able to deal with any estimation problem. This framework is based on a new theoretical concept, the concept of continuous symmetry. Detecting the continuous symmetries of a given system has a very practical importance. It allows us to detect an observable state whose components are non linear functions of the original non observable state. The general theory has been developed during the last two years. Preliminary results have been published in 2010 [72] and a more complete version of these results, which include several extensions, has been published on Transaction on Robotics, in 2011 [9] .
In 2011, this general framework has been extensively applied to investigate the problem of the fusion of visual and inertial data in the framework of the European project sFly. Special emphasis has been devoted to the structure from motion problem (SfM) when fusing these data. This problem has particular interest and has been investigated by many disciplines, both in the framework of computer science ( [35] , [54] , [56] , [87] and references therein) and in the framework of neuroscience and vision perception ([67] , [95] and references therein). Even though prior work has answered the question of which are the observable modes, i.e. the states that can be determined by fusing visual and inertial measurements [35] , [54] , [56] , the questions of how to compute these states in the absence of a prior, and of how many solutions are possible, were still unanswered. During 2011, we have derived, for the first time, a closed form solution to the SfM problem in this case, allowing the determination of the observable modes without the need for any prior knowledge. The proposed solution analytically expresses all the observable modes in terms of the visual and inertial measurements acquired during a given (short) time-interval allowing the determination of all the observable modes without the need for any prior knowledge. Additionally, we have shown that this problem can have a unique solution or two distinct solutions or infinite solutions depending on the trajectory, on the number of point-features and on the number of monocular images where the same point-features are seen. Our results are relevant in all the applications which need to solve the structure from motion problem with low-cost sensors and which do not demand any infrastructure. Typical examples are the emergent fields of space robotics [77] , humanoid robotics and unmanned aerial navigation in urban-like environments [93] , where the use of the GPS is often forbidden. Furthermore, our results could play an important role in neuroscience by providing a new insight on the process of vestibular and visual integration. To this regard, we remind the reader that the influence of extra retinal cues in depth perception has extensively been investigated in the last decades. In the case when this extra retinal cue is the motion parallax induced by self-motion relative to a stationary environment, the scale factor is provided by the head velocity [65] , [66] . The vast majority of these studies, consider the case when the head motion is active [38] , [94] . This prevents the possibility to understand the contribution of the vestibular signals because of efference copy generated by active self movement. However, a very recent study investigates this problem by performing trials with passive head movements [43] . The conclusion of this study is that the combination of retinal image with vestibular signals can provide rudimentary ability to depth perception. Our findings could provide a new insight to this problem of depth perception since by combining retinal image with vestibular signals it is possible to determine the scale factor even without any knowledge about the initial speed. New trials would be necessary in order to verify whether a mechanism reproducing our closed form solution is present in humans and/or in other animals (especially the ones without binocular vision). Our findings also show that it is possible to easily distinguish linear acceleration from gravity. Specifically, our closed form solution perform this determination by a very simple matrix inversion. This problem has also been considered in neuroscience [75] , [31] . Our results could provide a new insight to this problem since they clearly characterize the conditions (type of motion, features layout) under which this determination can be performed.
Our results have been published in three conference papers [14] , [11] , [15] and have been accepted for publication in transactions on robotics (a version is currently available as a technical report, [29] ).
In parallel to this theoretical activity an experimental activity has started in order to experimentally validate our findings in the near future and to deploy our technologies to industrial partners. To this regard, a contact with the company Delta Drone in Grenoble has been established and a valorization contract with a SME in the field of civil drone applications is currently in preparation.
Analysis of dynamic scenes for collision risk assessment
Participants : Mathias Perrollaz, John-David Yoder, Amaury Nègre, Christian Laugier, Igor Paromtchik.
The grid-based environment representation is used for dynamic scene analysis in the Arosdyn project [78] . The original idea behind the risk estimation approach developed in the e-Motion team consists in considering the possible behaviors of the vehicles in the scene. Indeed, with the classical TTC(time to collision)-based approach, the risk is estimated based on the prediction of the trajectory, considering the current state of the objects. This is only valid for very short term predictions, and in some cases it can result in a over-estimation of the collision risk. Understanding the intention of the other participants of the road scene allows a longer term, more precise prediction of trajectories.
Our approach is divided into two steps: behavior recognition and behavior realization. The behavior recognition aims at estimating the probability for a vehicle to perform one of its feasible behaviors. The behaviors are semantic representations of driving maneuvers (e.g. turn left, turn right, go straight, ...). The probability distribution over possible behaviors is obtained by inference using layered HMMs. Driving behavior realization is modeled as Gaussian Process (GP). This model allows us to obtain the probability distribution over the physical realization of the vehicle motion (i.e. trajectories) by assuming a usual driving, for a given behavior.
Finally, a complete probabilistic model of the possible future motion of the vehicle is given by the probability distribution over driving behaviors, and by the realization of these behaviors. The risk calculation is performed by sampling of the paths from the corresponding GP. The fraction of the samples in collision gives the risk of collision.
In 2011, we conducted some early experiments on sensor fusion, using real data acquired with our Lexus experimental vehicle [16] . Moreover, the global framework of the Arosdyn project has been presented in [8] .
Recognition for intelligent vehicles
Participants : Alexandros Makris, Mathias Perrollaz, Amaury Nègre, Igor Paromtchik, Christian Laugier.
We developed a generic object class recognition method. The method uses local image features and follows the part based detection approach. The state-of-the-art visual object class recognition systems operate with local descriptors and codebook representation of the objects. Various local features (e.g. gradient maps, edges) are used to create the descriptors. Then kernel based classifiers are commonly employed to classify the detected features in one of several object classes [32] [45] . The recognition of vehicles or pedestrians from sensors mounted on a moving platform is achieved by different approaches using various types of sensors, e.g. stereo camera, laser [51] [44] . The approaches that perform data fusion from various sensors have proven to be the more robust in a variety of road conditions [86] .
This work focuses on the development of an object class recognition system which follows the part based detection approach [64] . The system fuses intensity and depth information in a probabilistic framework. To train the system for a specific object class, a database of annotated with bounding boxes images of the class objects is required. Therefore, extending the system to recognize different object classes is straightforward. We apply our method to the problem of detecting vehicles by means of on-board sensors. Initially, depth information is used to find regions of interest. Additionally, the depth of each local feature is used to weight its contribution to the posterior of the object position in the corresponding scale. The votes are then accumulated in a 3d space-scale space and the possible detections are the local maxima in that space. Figure 12 presents the steps of our approach.
|
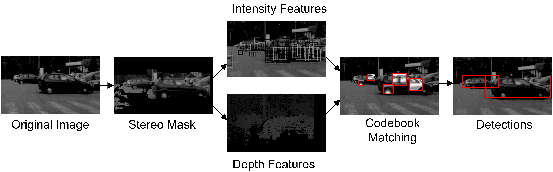
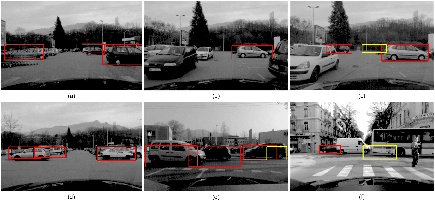
The novelty of our approach is the fusion of depth and intensity information to form a probabilistic part-based detector. Using depth information is beneficial for the robustness of the approach, because we avoid including many noisy detections resulting from false matches between features of different scales. The method is tested with stereo video sequences captured in an urban environment. Fig. 13 shows some example detections. The proposed method detects side-views of cars in various scales, in cases with partial occlusions, and under significant background clutter.
|
Context-aware Bayesian estimation of risk at road intersections for cooperative vehicles
Participants : Stéphanie Lefèvre, Christian Laugier.
The work developed in this PhD is done in collaboration with Renault (CIFRE thesis) and concerns safety applications for cooperative vehicles.
In a few years, car manufacturers will start equipping vehicles with V2X communication devices, which will allow vehicles to share information with other vehicles and with roadside units using a dedicated communication channel. This new sensor on the car opens a whole new world of possibilities for Advanced Driver Assistance Systems (ADAS). In particular, the fact that the vehicle is able to “see” a car before it even enters the field-of-view of the driver allows for a better assistance in the tasks of perceiving, analyzing, predicting, and estimating the risk of a situation.
Early in the PhD we identified safety applications at road intersections as a relevant application domain for V2X technologies. The variety and complexity of scenes at road intersections makes reasoning and interpretation particularly difficult. On the other hand, intersections are a location of many accidents (they represent up to 50% of accidents in some countries), therefore reducing the accident rates in these areas would have a considerable impact of global traffic safety. We also identified the key issues (and challenges) to be 1) situation understanding and 2) risk assessment, to be carried out from incomplete models and uncertain data.
The focus of the year 2010 was on the first of these two problems. We developed a Bayesian Network that could estimate a driver's intended exit lane at an intersection based on the current state of the vehicle (position, orientation, turn signal state) and on contextual information extracted from the digital map. The idea was to use the information on the geometry of the road network and on the connectivity between lanes to build a statistical model of the relationship between the position and turn signal of a vehicle and the driver's intended exit lane. Initial results of this work were published in IEEE CIVTS'11 [12] , then in IEEE IV'11 [13] with a more thorough evaluation.
The objective of the work conducted in 2011 was twofold:
-
Extend the initial system: add some filtering and take into account the priority rules.
-
Estimate the risk of a situation, based on the estimated behavior/intention of the drivers in the scene.
We proposed a probabilistic motion model for vehicles approaching and traversing an intersection that incorporates some knowledge about how the context (i.e. the traffic rules, the presence of other vehicles, the geometry and topology of the intersection) influences vehicle behavior. The distinctive features of our algorithm are:
-
The explicit use of priority rules
Priority rules are explicitly taken into account in the motion model: the necessity for a driver to stop and/or yield to another vehicle at an intersection is estimated, jointly with the driver’s intention to comply. This allows for a flexible and computationally inexpensive computation of risk. Flexible because depending on the final application one can decide to compute different types of risk, e.g. the probability that a specific vehicle is a violator, or the probability that a crash will occur between two vehicles, or the risk of a specific maneuver for a vehicle. Inexpensive because these can be computed without performing trajectory prediction for the vehicles in the scene.
-
The assumption that drivers generally respect traffic rules
Instead of making the classical assumption that vehicles’ trajectories are independent, we model their mutual influences by introducing a prior knowledge that drivers generally respect priority rules. The motion model therefore takes into account the priority rules and the presence of other vehicles to better interpret correctly a vehicle’s behavior. The advantages are twofold. Firstly, we are able to better estimate the maneuver intention of the drivers, which means our situation assessment capabilities are improved. Secondly, risk is estimated with a higher sensitivity. We avoid risk overestimation while still being able to detect dangerous situations as well as the conventional, more conservative, methods.
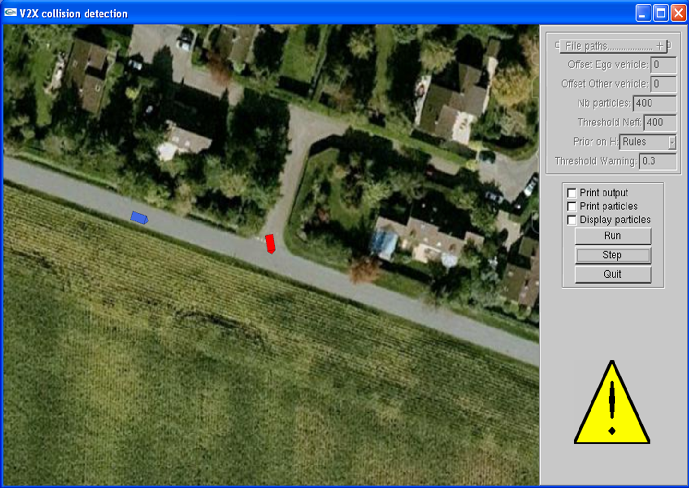
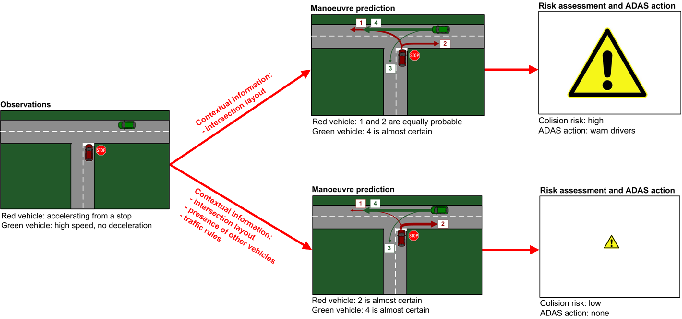
This reasoning is implemented using a Bayesian filter which estimates the hidden variables M (maneuver intention), D (distance to intersection), H (intention to stop) and H' (necessity to halt) jointly for all the vehicles in the scene, using the position, speed and heading information shared between the vehicles via V2X communication. Inference on the hidden variables is carried out by a particle filter. The algorithm was described in an INRIA research report [27] . In this report we showed by reasoning on theoretical scenarios that our assumption that drivers tend to respect priority rules should lead to improved situation assessment and risk assessment (see Fig. 14 ).
|
Recently, data has been collected at an intersection using the Renault demonstrator vehicles, so that our algorithm can be tested on real data. Preliminary results seem to confirm that the intuitions described in the research report were correct. A Graphical User Interface is in the process of being developed so that demonstrations of the system can be carried out live in the Renault demonstrator vehicles (see Fig. 15 ).