

Section: New Results
EVE : Evolutionary Visual Exploration
Participants : Evelyne Lutton [correspondant] , Nadia Boukehlifa, Waldo Cancino, Anastasia Bezerianos.
Evolutionary Visual Exploration (EVE) is a new approach that combines visual analytics with stochastic optimisation to aid the exploration of multidimensional datasets characterised by a large number of possible views or projections. A prototype tool (EvoGraphDice) has been built as an extension of GraphDice, this work has been funded by the System@tics project CSDL, see Figure 10 .
|
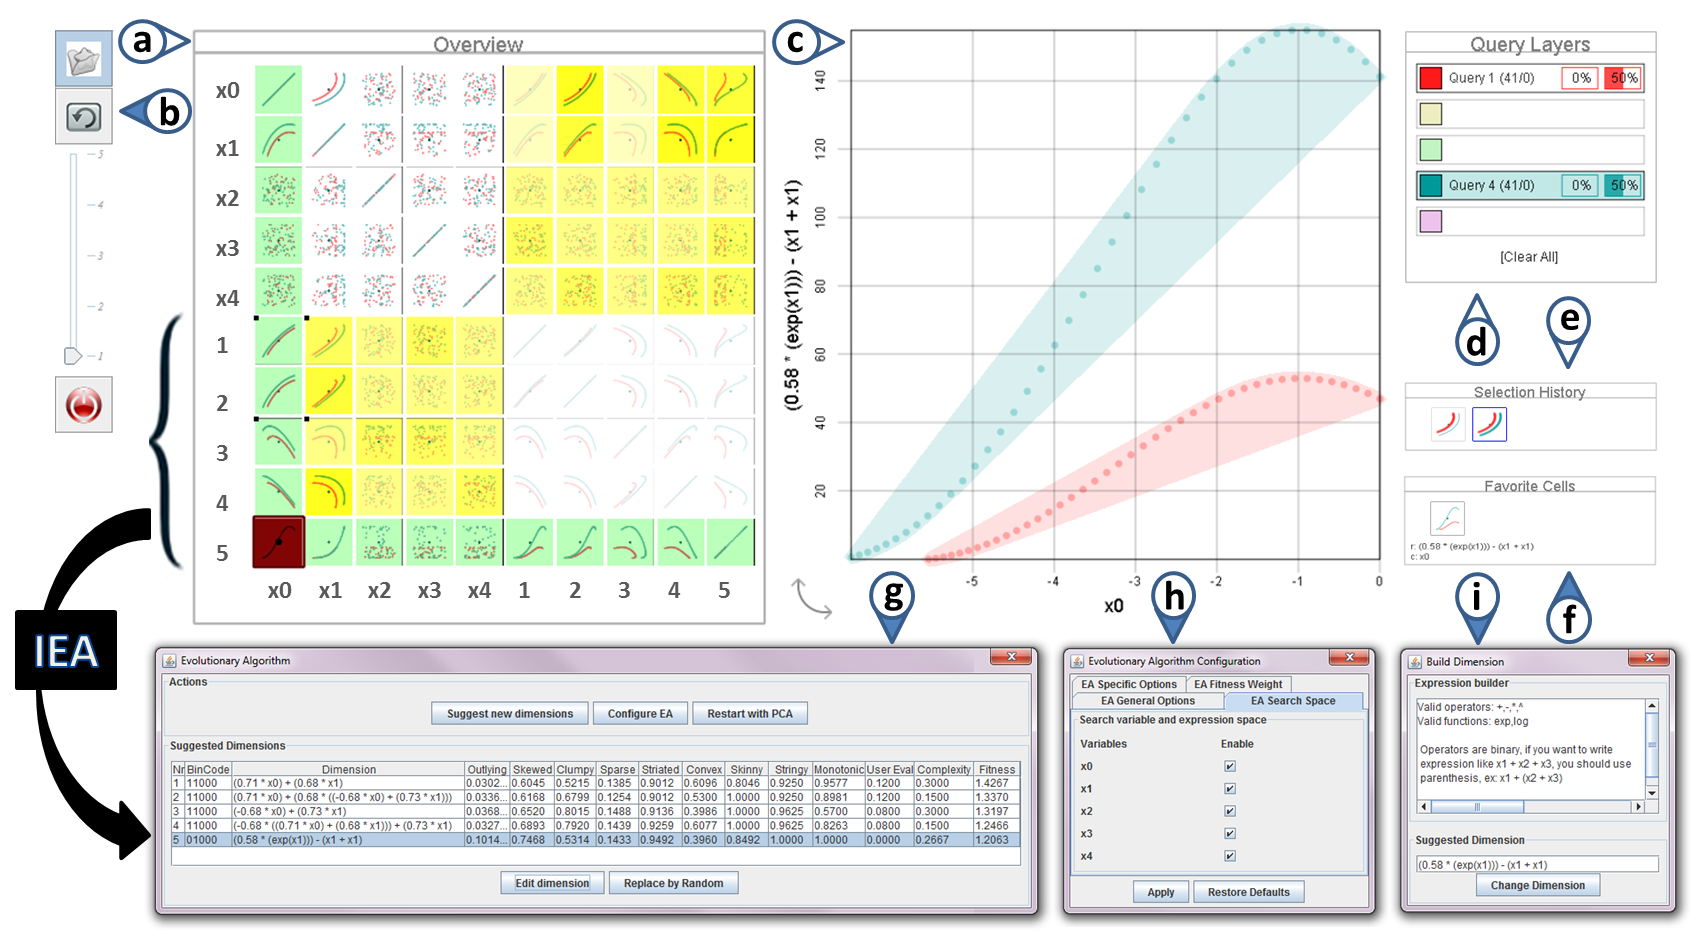
Starting from dimensions whose values are automatically calculated by a PCA, an interactive evolutionary algorithm progressively builds (or evolves) non-trivial viewpoints in the form of linear and non-linear dimension combinations, to help users discover new interesting views and relationships in their data. The criteria for evolving new dimensions is not known a priori and is partially specified by the user via an interactive interface: (i) The user selects views with meaningful or interesting visual patterns and provides a satisfaction score. (ii) The system calibrates a fitness function (optimised by the evolutionary algorithm) to take into account the user input, and then calculates new views. Our method leverages automatic tools to detect interesting visual features and human interpretation to derive meaning, validate the findings and guide the exploration without having to grasp advanced statistical concepts. To validate our method, we conducted an observational study with five domain experts. Our results show that EvoGraphDice can help users quantify qualitative hypotheses and try out different scenarios to dynamically transform their data. Importantly, it allowed our experts to think laterally, better formulate their research questions and build new hypotheses for further investigation.