Section: New Results
Visualization for Interactive Displays
Participants : Tobias Isenberg [correspondant] , Petra Isenberg.
Because the access to and analysis of information is becoming increasingly important anywhere and at any time, researchers have begun to investigate the role of interactive displays as data analysis platforms. Visualization applications play a crucial role in data analysis and development of dedicated systems and tools for small to large interactive displays to support such application contexts is underway. We contribute a systematic and quantitative assessment of the literature from ten different venues, an open repository of papers, and a code-set that can be used to categorize the research space [22] . We found just over 100 publications at the intersection of interactive surfaces and visualization in our careful examination of 10 different publication venues related to the topic. We found that research has so far largely focused on the development of interaction techniques, for multi-touch tabletop devices, and 2D spatial and abstract visualizations. Together, all publications addressed a wide spectrum of research questions and, given the many possible combinations of interactive surfaces and visualization, the research space is still wide open. While several projects developed applications for data analysis with visualization on interactive surfaces, their availability in practice is still rare. Commercial companies and open-source communities have begun to provide ported versions of their products/tools for tablets and mobile phones (e.g., Tableau Mobile 4 and KiwiViewer 5), showing the need for visualization application on surfaces. Nevertheless, the support for data analysis tasks on these and other interactive surfaces can certainly still be improved—a lot more research with respect to the development and evaluation of the fundamentals of data exploration and analysis is needed for interactive displays. Some example directions of future work in this context were outlined in research agendas published in the journal IEEE Computer [24] as well as in IEEE Computer Graphics and Applications [21] .
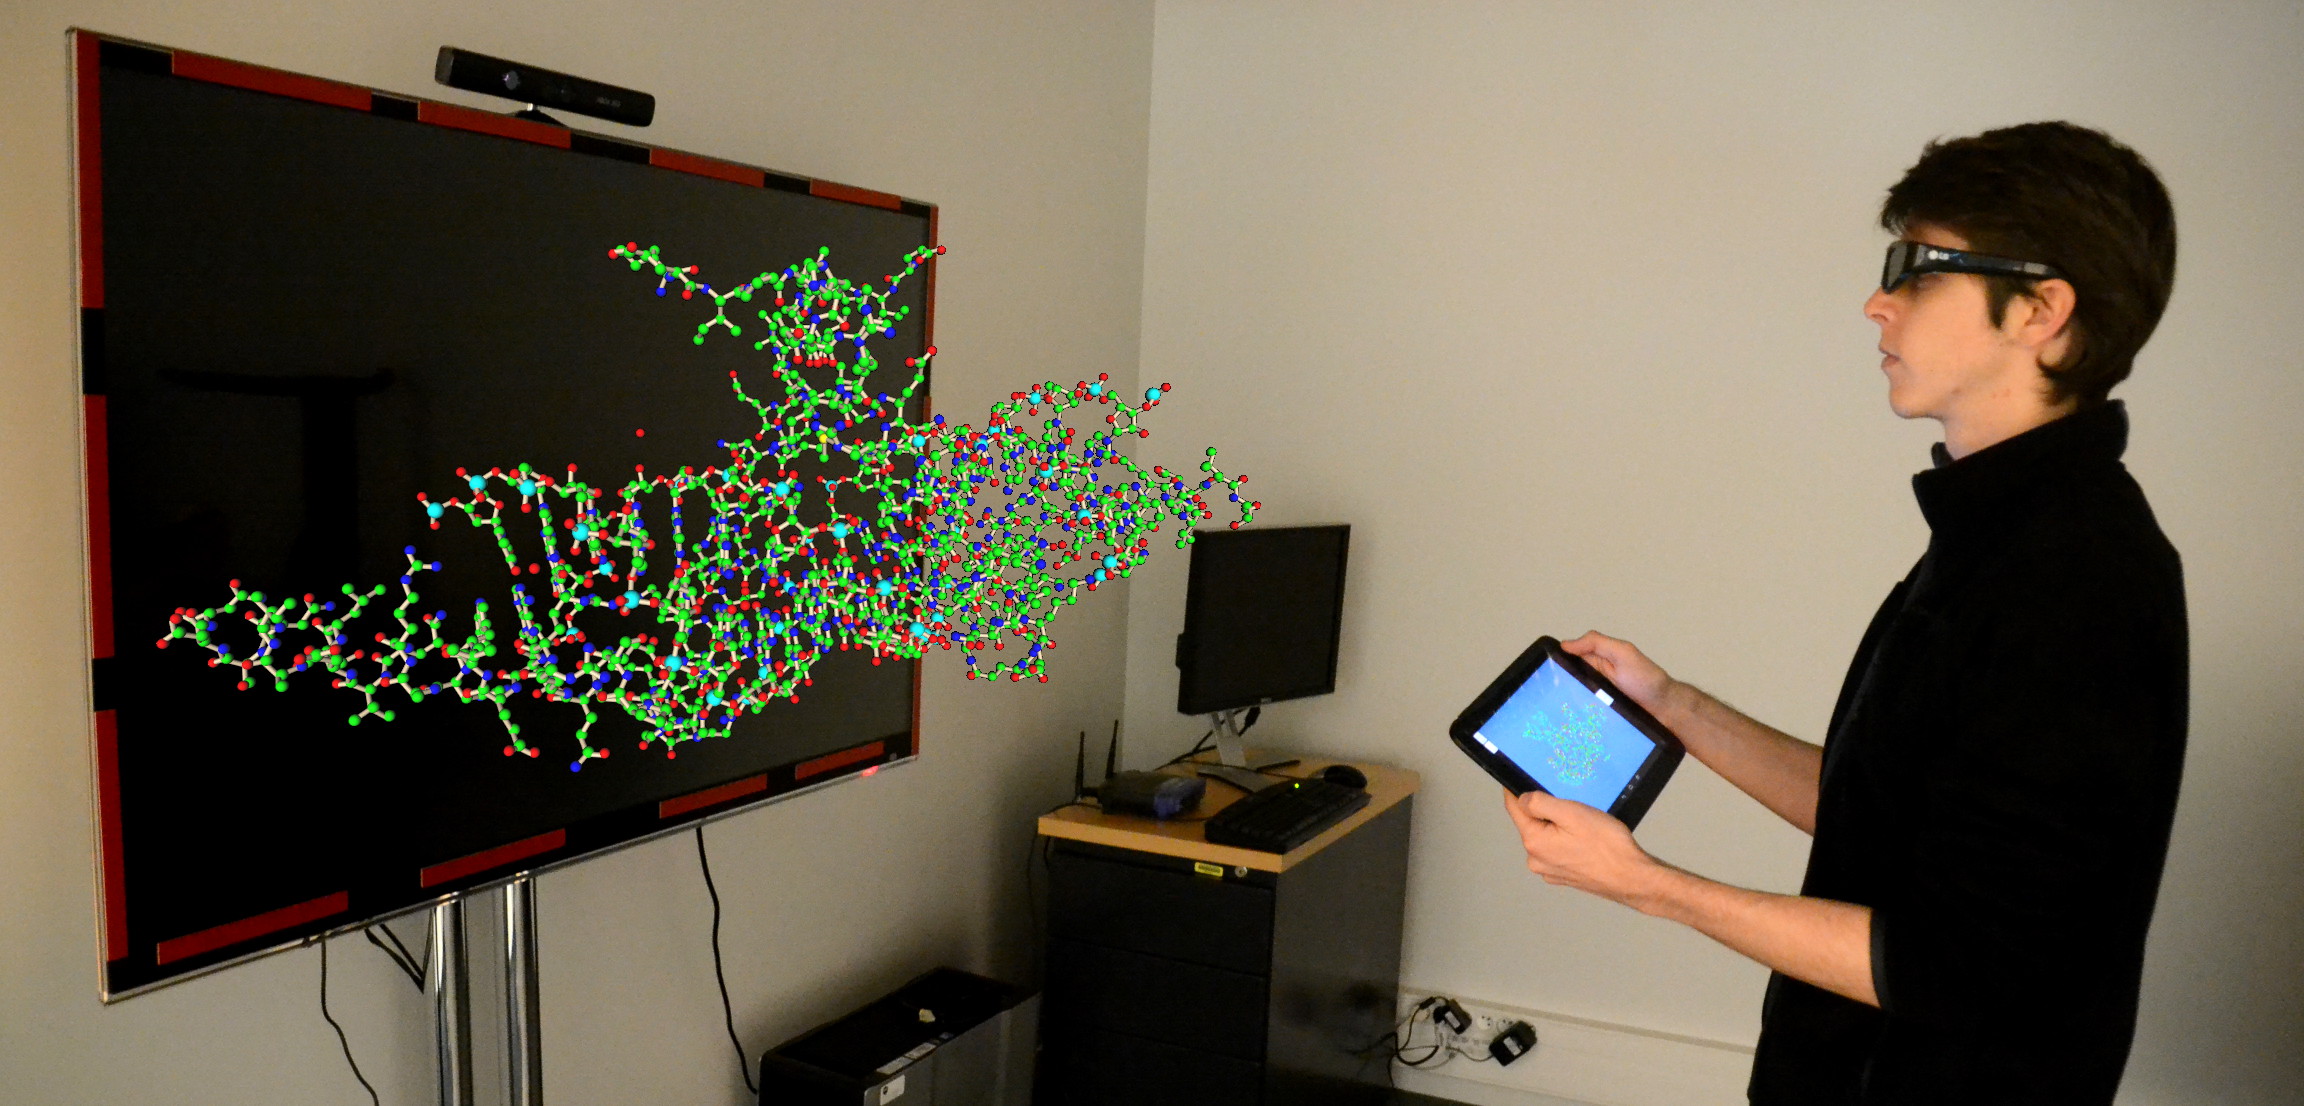
In a specific project investigated an interaction design concept for exploratory 3D data visualization that marries direct-touch interaction with stereoscopic vision. The design is inspired by the mental mapping that occurs for mouse interaction where the physical control space is mapped through a mental rotation to the display space. Similarly, we explore touch interaction on a monoscopic tablet, mapped through a mental rotation to the stereoscopic display space. Because this mental mapping can become increasingly skewed we show when and how to re-synchronize the views (see Figure 9 ).