

Section: New Results
Visualization for Soccer Analysis
Participants : Charles Perin, Romain Vuillemot, Jean-Daniel Fekete [correspondant] .
A new generation of soccer data is now available, as some companies (http://www.optasports.com/ ) collect and provide extensive data covering almost all professional soccer championships, with a wealth of multivariate information related to time, player positions, and types of action, to name a few. Currently, most analysis on such data relate to statistics on individual players or teams. For instance, statistics on “team ball possession” and “number of goal attempts for team A or B” are popular on websites, TV and newspapers and often accompanied by bar charts or plots on a soccer field. However, soccer analysts we collaborated with consider that quantitative analysis alone does not convey the right picture of the game, as context, player positions and phases of player actions are the most relevant aspects.
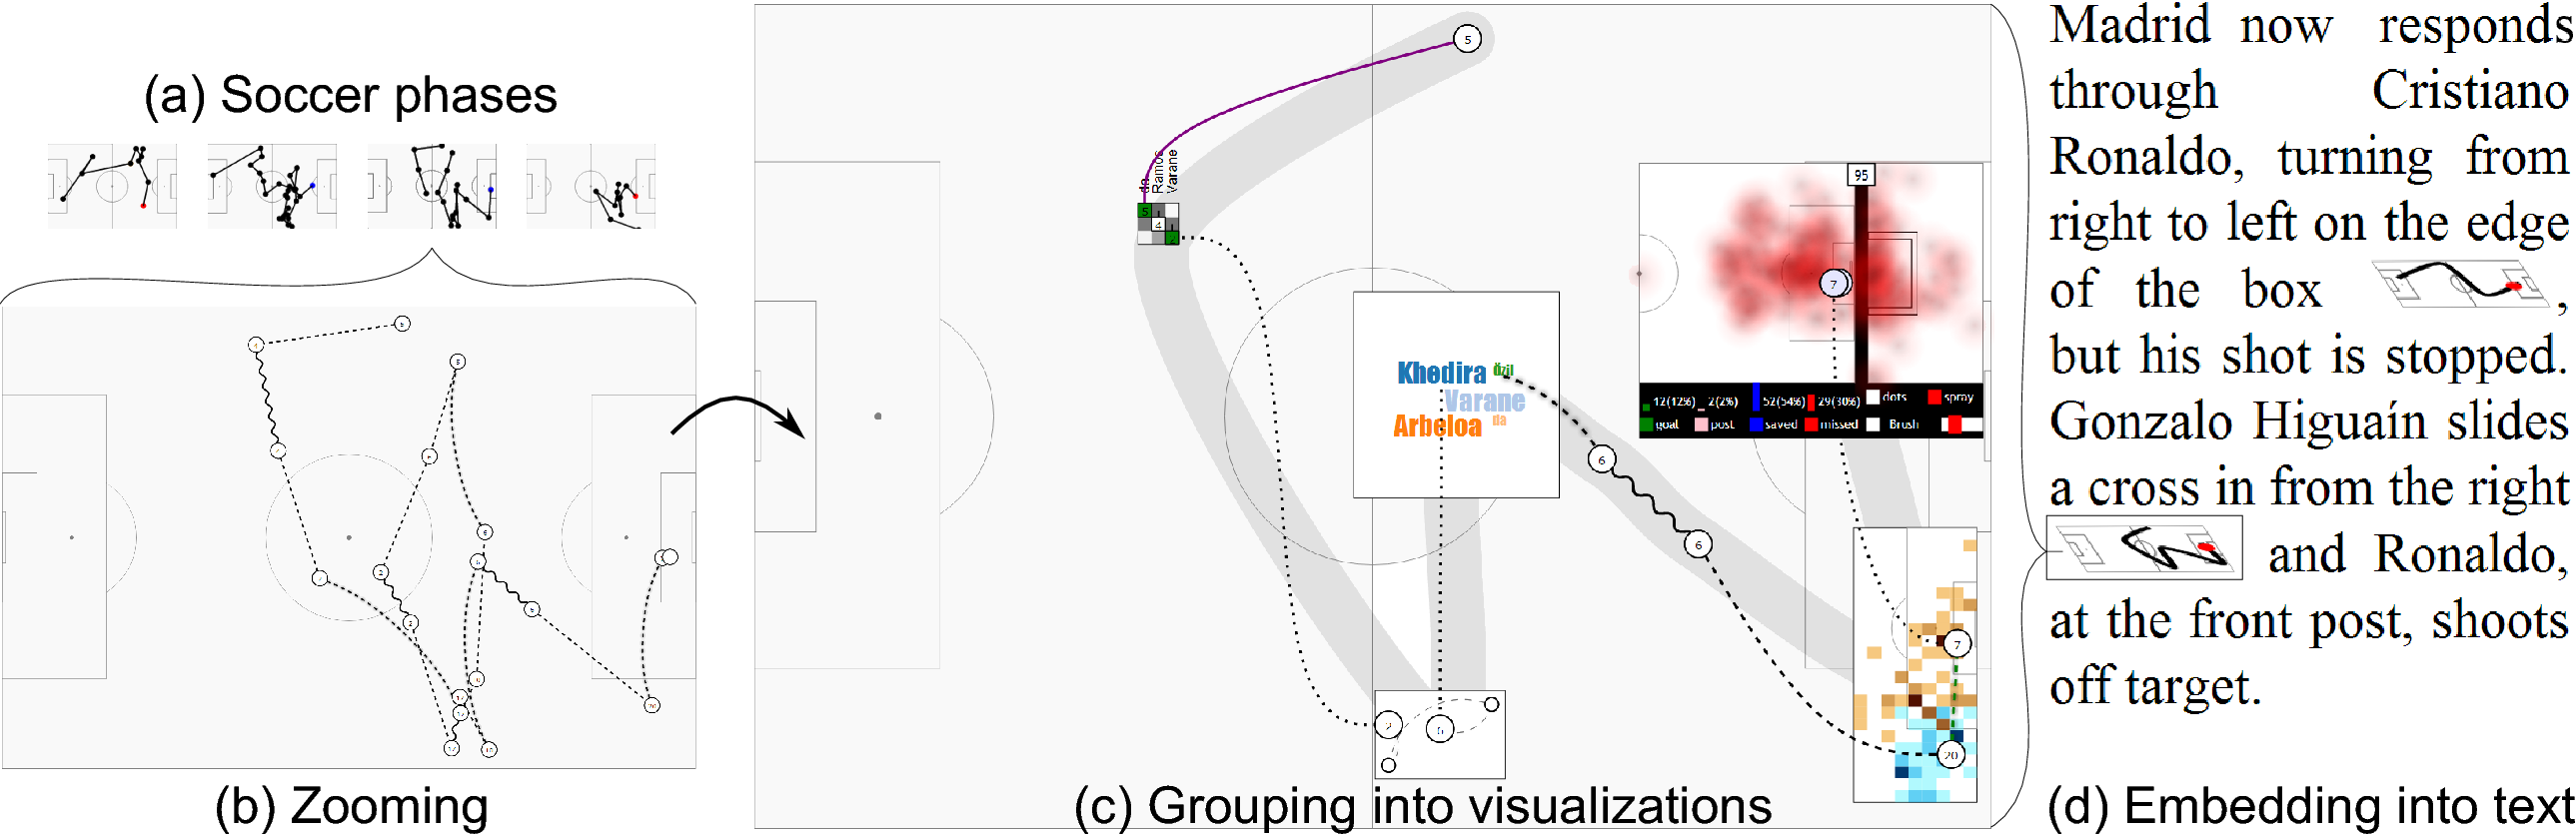
SoccerStories [27] (Figure 10 ) is a visualization interface to support analysts in exploring soccer data and communicating interesting insights that we designed to support the current practice of soccer analysts and to enrich it, both in the analysis and communication stages. Our system provides an overview+detail interface of game phases, and their aggregation into a series of connected visualizations, each visualization being tailored for actions such as a series of passes or a goal attempt. To evaluate our tool, we ran two qualitative user studies on recent games using SoccerStories with data from one of the world's leading live sports data providers. The first study resulted in a series of four articles on soccer tactics, by a tactics analyst, who said he would not have been able to write these otherwise. The second study consisted in an exploratory follow-up to investigate design alternatives for embedding soccer phases into word-sized graphics. For both experiments, we received a very enthusiastic feedback and participants consider further use of SoccerStories to enhance their current workflow. This article received a Best Paper Honorable Mention in VIS 2013.
|
We also explored how spectators of a live soccer game can collect detailed data while watching the game [47] . Our motivation arouse from the lack of free detailed sport data, contrasting with the large amount of simple statistics collected for every popular games and available on the web. Assuming many spectators carry a smart phone during a game, we implemented a series of input interfaces for collecting data in real time. In a user study, we asked participants to use those interfaces to perform tracking tasks such as locating players in the field, qualifying ball passes, and naming the player with ball while watching a video clip of a real soccer game. Our two main results are 1) the crowd can collect detailed and fairly complex data in real-time with reasonable quality while each participant is assigned a simple task, and 2) a set of design implications for crowd-powered interfaces to collect live sport data. We also discuss the use of such data into SoccerStories, and the design implications coming with the visual communication of missing and uncertain detailed data.
Finally, we presented R2S2 [46] in the SportVis workshop (VIS 2013), a hybrid visualization technique as an intermediate step between Rank Chart and Slope Graph to better understand and analyze team evolutions during soccer championships. Currently used rank tables for soccer are relative (ranked-based) and do not convey the absolute difference between teams. R2S2 provides a way to visualize these differences using the Slope Graph technique (value-based). By interactively setting the parameters of R2S2, we make the distance between teams appear, minimizing the overlaps caused by the Slope Graph technique.
More information about these projects is available at http://www.aviz.fr/soccer .