

Section: New Results
Network Visualization
Participants : Benjamin Bach [correspondant] , Basak Alper, Andre Spritzer, Emmanuel Pietriga, Nathalie Henry-Riche, Tobias Isenberg, Jean-Daniel Fekete.
Although much research has been done on finding efficient ways to visualize different kinds of networks (social networks, computer networks, brain networks, etc), many problems are still open. Rather than trying to find optimal layouts, we focus on novel representation and navigation techniques to explore such networks. Our research focusses on three major problems: (i) heterogeneous networks, (ii) comparison of graphs, (iii) dynamic networks, and (iv) generating networks for controlled user evaluations.
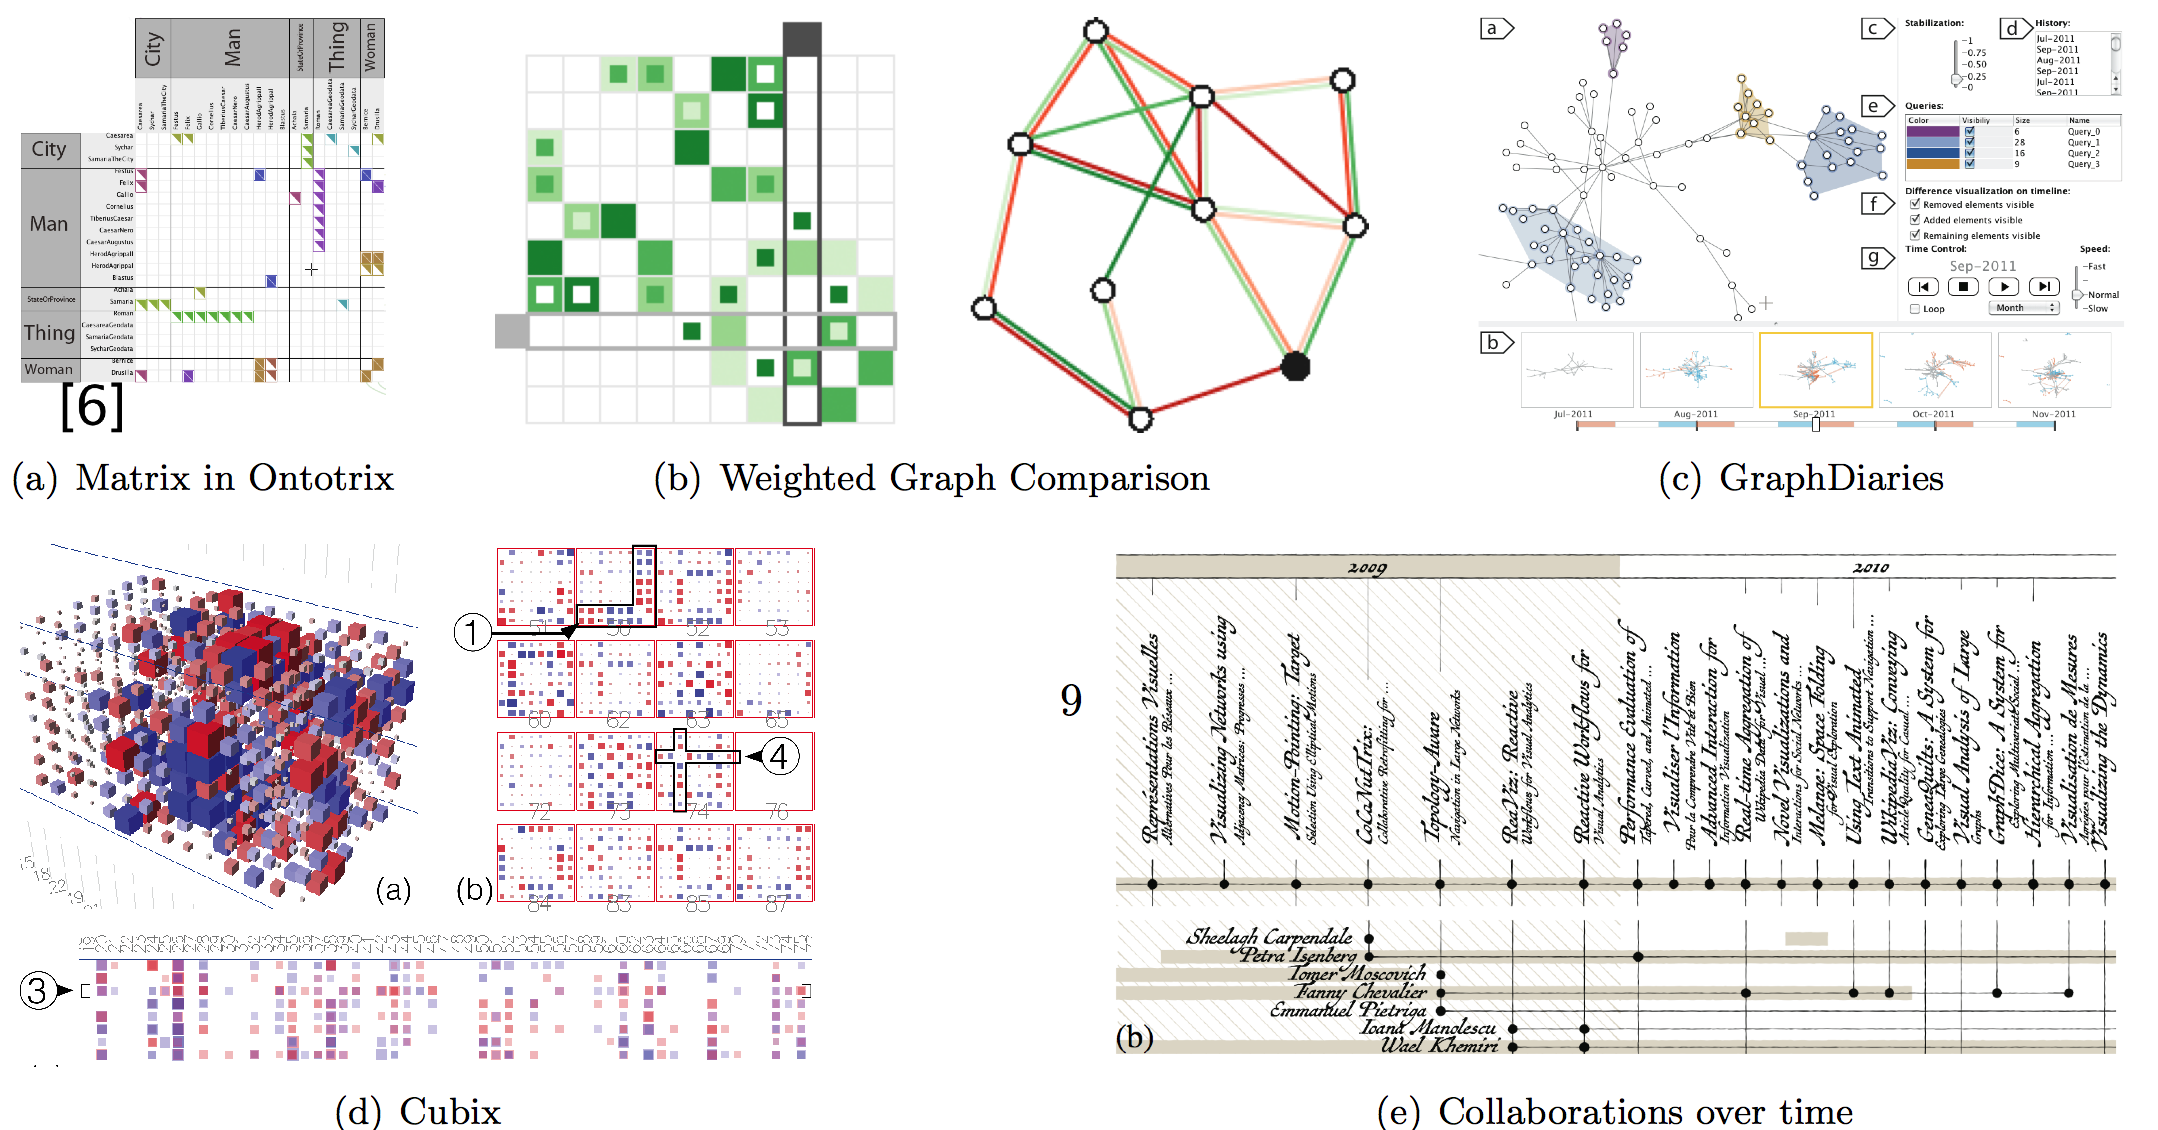
Heterogeneous Networks: Heterogeneous networks are networks with multiple node and edge types, such as ontologies in the Semantic Web. Ontologies also provide means to describe type hierarchies on node and edge types as well as other set theoretic relations between these types. Such heterogeneous networks can be explored on two levels, the model (types and possible relations between types), and instances (actual nodes and their connections). In order to allow for interactive exploration of such data, we extended the NodeTrix technique [68] to visualize ontologies. Our prototype is called OntoTrix [11] (Figure 11 (a), which allows for reorganizing matrices by splitting and merging them, traversing node and edge hierarchies and visualize different types of connection between nodes.
Graph Comparision: Analyzing brain networks, which can represent anatomical fibers as well as functional correlation between brain regions, is complex in many ways. By analysing brain scientists tasks we concluded that many user tasks can actually performed by comparing two networks. In [29] (Figure 11 (b)) we design and discuss several ways to compare two weighted graphs and finally compare the two most promising designs in a controlled user study. We found that our encoding for adjacency matrices outperforms the one for node-link diagrams, even for sparse networks. The implications for brain analysis tools are manyfold and our results generalize to other domains that are concerned with comparing (dense and weighted) networks.
Dynamic Networks: A very common technique to explore dynamic networks are animations and small multiples, each of which being supporting different tasks, while falling short on others. With GraphDiaries [10] (Figure 11 (c)), we design an interface based on the combination of both techniques while offering flexible temporal navigation techniques as well as enhanced perceptive feedback to understand changes between time steps. GraphDiaries supports further navigation techniques such as temporal aggregation, direct difference views and layout adjustment. While GraphDiaries is highly extensible, its techniques are designed to be integrated in existing visualization tools.
While animations and the techniques in GraphDiaries are useful for many networks, dense dynamic networks are still an important open problem. We hence generalized the idea of matrices to visualize temporal networks, by describing a visualization and interaction model based on the space time cube metaphor (Figure 11 (d)). In analogy with the physical world, this Matrix Cube can be manipulated and decomposed in order to explore the network, while the cube model serves as a consistent visual and mental model of the data and visualization. We implemented an interface called Cubix that allows us to perform simple view switches and decomposition operations in the cube. Cubix and the Matrix Cube was evaluated with two experts, an astronomer and brain scientist, exploring their own real world data. With the Matrix Cube and its decomposition operations, we are able to visualize and navigate within very dense dynamic networks such as brain networks, trading flows and technical networks. The design space of possible visualizations that the Matrix Cube and its operations offer is both, huge but structured at the same time. It allows us to explore many future designs.
As part of the effort of visualizing publications and work of Jean-Daniel Fekete, we designed a visualization to show his collaborations over the past years, relating his papers and his collaborators [30] (Figure 11 (e)). A poster was presented at part of a poster submission to IEEE Vis, 2013 in Atlanta. To the best of our knowledge, no such technique to visualize any sort of dynamic ego networks have been published so far.
Network Generation: As any controlled user study, evaluating network visualizations requires control over the data. However, it is hard to found real world data with the desired properties and in reasonable amount for a controlled user study. Synthetic data can help but the output of random graph generators is hard to control and hardly resembles actual real-world data. With GraphCuisine [57] we present and interactive approach to generate graphs. In an iterative process, the computer generates suggestions while the user selects her preferred graphs and graph measures.