

Section: New Software and Platforms
Time Curves
Participants : Benjamin Bach, Pierre Dragicevic [correspondant] , Conglei Shi, Nicolas Heulot.
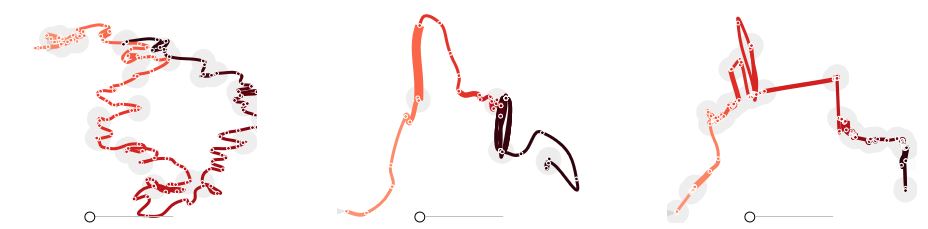
We introduced time curves as a general approach for visualizing patterns of evolution in temporal data [2]. Examples of such patterns include slow and regular progressions, large sudden changes, and reversals to previous states. These patterns can be of interest in a range of domains, such as collaborative document editing, dynamic network analysis, and video analysis. Time curves employ the metaphor of folding a timeline visualization into itself so as to bring similar time points close to each other. This metaphor can be applied to any dataset where a similarity metric between temporal snapshots can be defined, thus it is largely datatype-agnostic. In our paper and on the online Website, we illustrate how time curves can visually reveal informative patterns in a range of different datasets.
More on the project Web page: www.aviz.fr/ bbach/timecurves.