

Section: New Results
Declarative Rendering Model for Multiclass Density Maps
Participants : Jaemin Jo [Dept. of Computer Science and Engineering, Seoul National University, South Korea] , Pierre Dragicevic, Jean-Daniel Fekete [correspondent] .
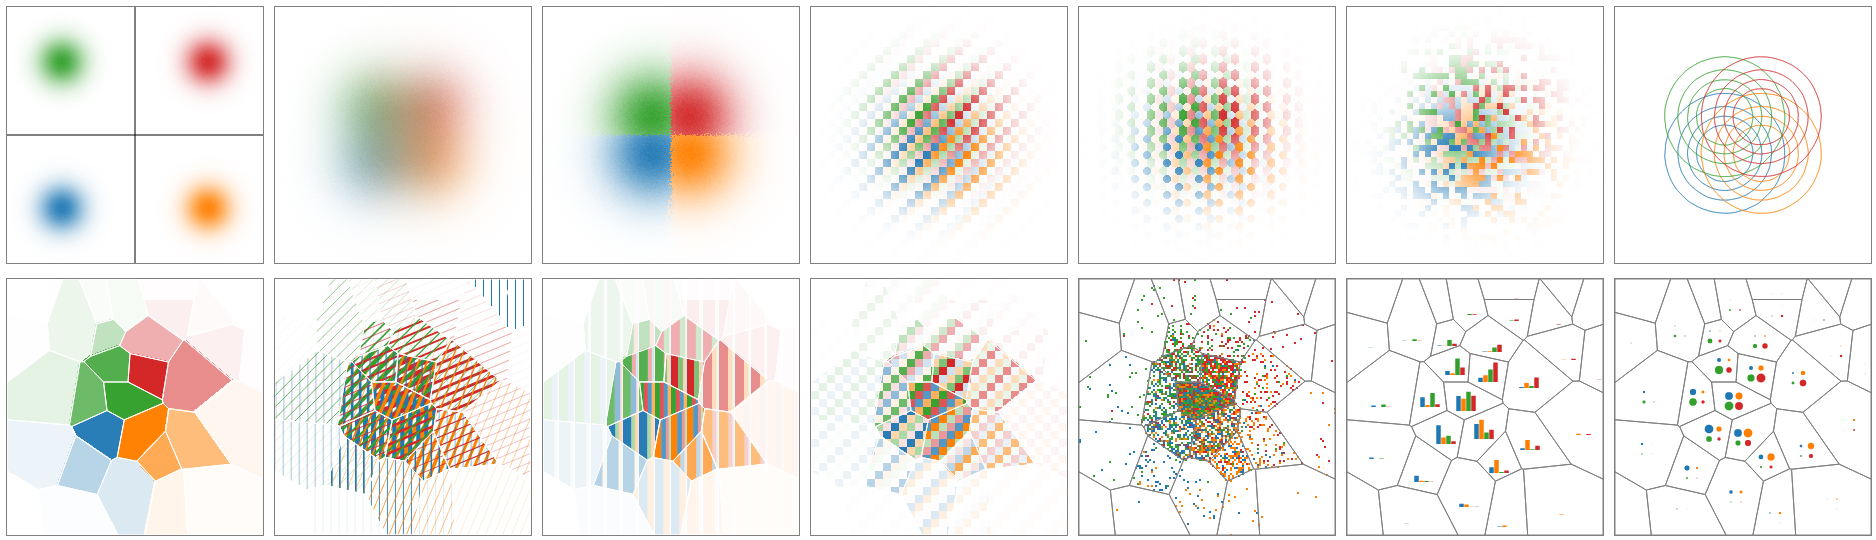
Multiclass maps are scatterplots, multidimensional projections, or thematic geographic maps where data points have a categorical attribute in addition to two quantitative attributes. This categorical attribute is often rendered using shape or color, which does not scale when overplotting occurs. When the number of data points increases, multiclass maps must resort to data aggregation to remain readable. We use a novel model called multiclass density maps: multiple 2D histograms computed for each of the category values. Multiclass density maps are meant as a building block to improve the expressiveness and scalability of multiclass map visualization. This library implements our declarative model: a simple yet expressive JSON grammar associated with visual semantics, that specifies a wide design space of visualizations for multiclass density maps. Our declarative model is expressive and can be efficiently implemented in visualization front-ends such as modern web browsers. Furthermore, it can be reconfigured dynamically to support data exploration tasks without recomputing the raw data. Finally, we demonstrate how our model can be used to reproduce examples from the past and support exploring data at scale.
More on the project page: Multiclass Density Maps.