

Section: New Results
Collaboration, Multi-display environments, Large and Small Displays
|
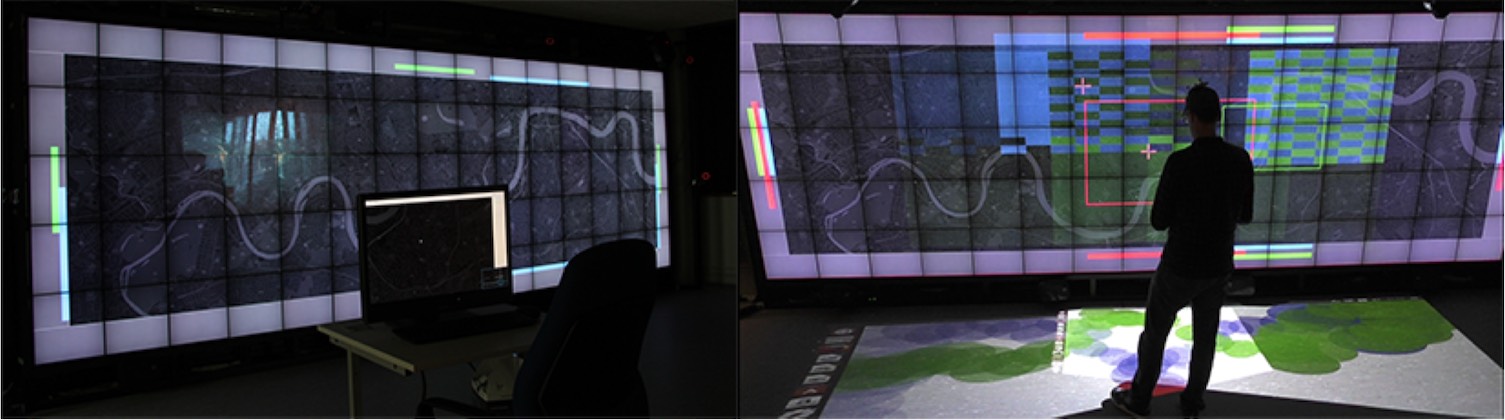
We studied awareness techniques to aid transitions between personal and shared workspaces in multi-display environments, that include large shared displays and desktops (Figure 8). In such contexts, including crisis management and control rooms, users can engage in both close collaboration and parallel or personal work. Transitioning between different displays can be challenging. To provide workspace awareness and to facilitate these transitions, we designed and implemented three interactions techniques that display users' activities. We explored how and where to display this activity: briefly on the shared display, or more persistently on a peripheral floor display. In a user study motivated by the context of a crisis room where multiple operators with different roles need to cooperate, we tested the usability of the techniques and provided insights on such transitions in systems running on MDEs [23]. We also contributed on a book chapter discussing how to best support collaboration in immersive environments that can range from MDE to mixed reality ones [28].
We collaborated with members from Inria project-team Aviz on the topic of small-scale visualization. This year, new results include a study about the perception of visualizations on smartwatches, performed together with Microsoft Research [11], [26]. The study was designed to assess how quickly people can perform a simple data comparison task for small-scale visualizations on a smartwatch. The goal was to extend our understanding of design constraints for smartwatch visualizations. We tested three chart types common on smartwatches: bar charts, donut charts, and radial bar charts with three different data sizes: 7, 12, and 24 data values. Results show that bar and donut charts should be preferred on smartwatch displays when quick data comparisons are necessary.