

Section: New Results
Smart Environment for Human Behaviour Recognition
Participants : Jean-Pierre Merlet, Yves Papegay, Odile Pourtallier [correspondant] , Eric Wajnberg.
The general aim of this research activity focuses on long term indoor monitoring of frail persons. In particular we are interested in early detection of daily routine and activity modifications. These modifications may indicate health condition alteration of the person and may require further medical or family care. Note that t our work does not aim at detecting brutal modifications such as faintness or fall.
In our research we envisage both individual and collective housing such as rehabilitation center or retirement home.
Our work relies on the following leading ideas :
-
We do not base our monitoring system on wearable devices since it appears that they may not be well accepted and worn regularly,
-
Privacy advocates adequacy between the monitoring level needed by a person and the detail level of the data collected. We therefore strive to design a system fitted to the need of monitoring of the person.
-
In addition to privacy concern, intrusive feature of video led us not to use it.
The main aspect that grounds this work is the ability to locate a person or a group in their indoor environment. We focus our attention to the case where several persons are present in the environment. As a matter of fact the single person case is less difficult.
Tools and data analysis for experimental systems
Two experimental systems are installed in two areas (a consultation center (Institut Claude Pompidou, ICP, Nice), and a retirement home (EHPAD Valrose, Nice)) were several types of persons (residents, visitors, staff) evolve. They are made up of virtual barriers (constituted of distance and motion sensors) displayed in the environment and connected to a PC that collects and stores the measurements of the barriers. Each crossing of a barriers hence corresponds to a specific signal of a set of sensors. We develop a set of codes that aim to analyze the data collected to construct information on the moves of the persons in the experiment areas [23].
This year we have improved the code that yields the barrier events (time and direction of crossing of barriers) from the raw data. This allowed us to use this first step to reconstruct the individual trajectories of the users.
Although the filtering technics do not use external information (such as specific use of a zone bounded by barriers, habit of users according to time....) we can determine most of the individual trajectories of the users, even when several users evolve simultaneously in the area. Although some uncertainties remain (and could probably be improved using external knowledge), we can use the results obtained to perform a statistical analysis.
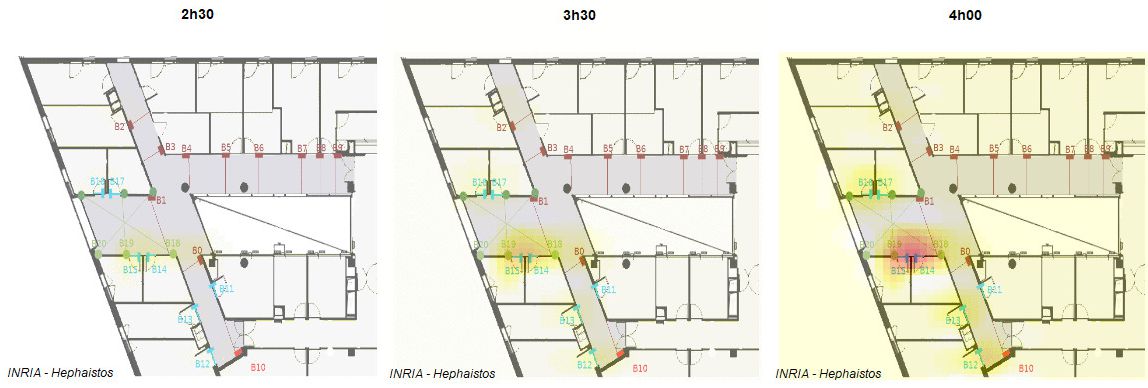
The aim on the main scientific efforts this year was to develop a detailed statistical treatment chain to extract and to visualize the events information coming from the set of movement activity detectors installed at ICP. All the (statistical and graphical) development were performed in the R software environment. Globally, two sets of information were collected, for the recorded data. The first provides a kinematic view of the presence of individuals on the mass plan of ICP during a chosen time interval. The following graph gives a static example of the kinematic graph obtained. Such a dynamic information points, for example, to specific movement activities in the medical center, at given time intervals. Figure 3 shows the presence of individuals in the corridors and consultation rooms at ICP at different times.
|
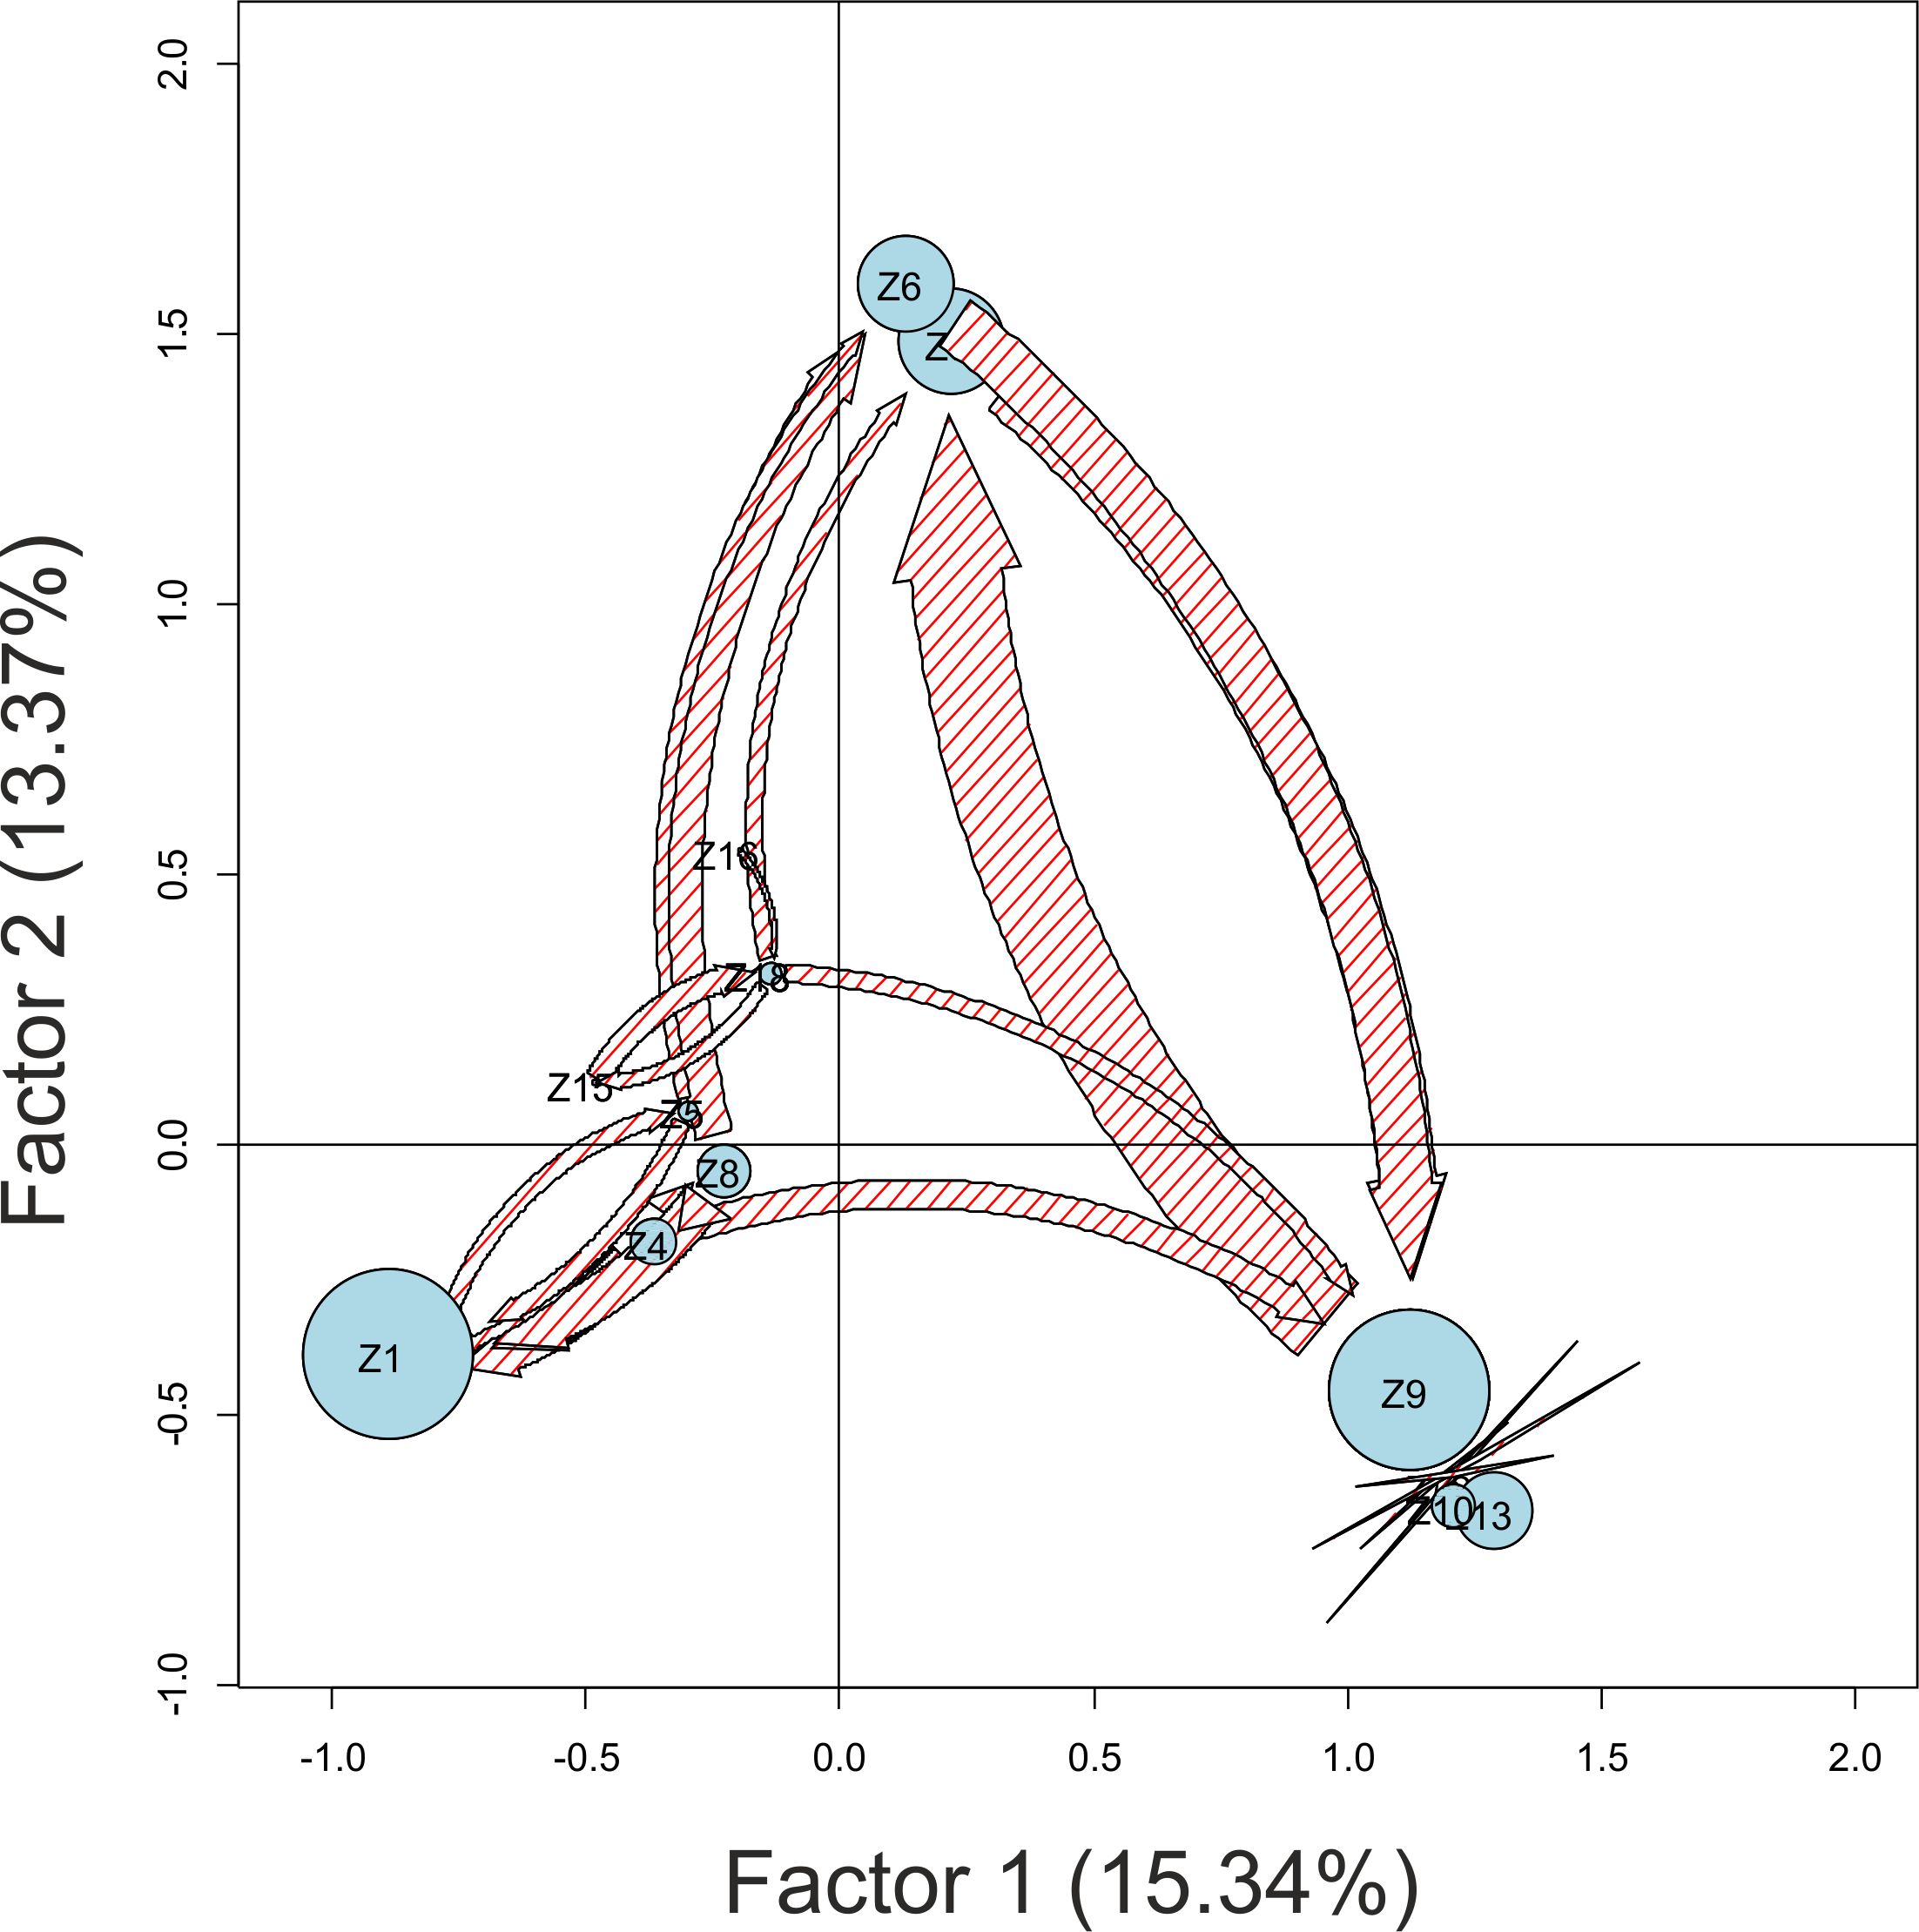
Such a graph is only descriptive. Hence, it does not provide a functional analysis of the displacements of individuals in the medical center. In order to understand this better, the chronological movement patterns were functionally described by building, for every time interval, the transition matrix between all zones present in the analyzed medical center. After proper algebraic manipulation, the obtained transition matrices were analyzed using a factorial correspondence analysis, a multivariate method that - in this case and among other features – built graphs describing the functional movement patterns between zones. The graph presented in figure 4 gives an example of the obtained results.
|
The next step will be to statistically compare such results, e.g., between morning or afternoon activity, between days with or without medical consultation, etc. Results obtained might lead to a better organization of the medical activities at ICP.