

Section: New Software and Platforms
Time Curves
Scientific Description
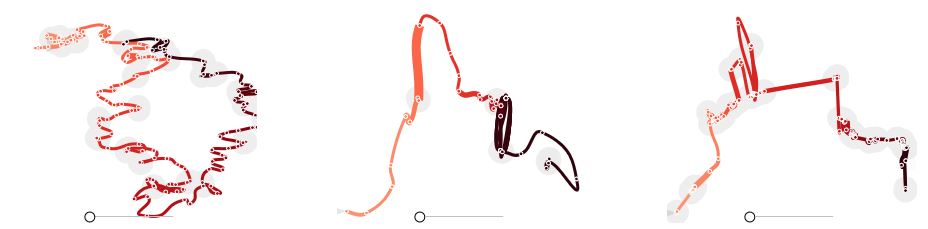
Time curves [13] , as seen in Figure 6 , are a general approach for visualizing patterns of evolution in temporal data. Examples of such patterns include slow and regular progressions, large sudden changes, and reversals to previous states. These patterns can be of interest in a range of domains, such as collaborative document editing, dynamic network analysis, and video analysis. Time curves employ the metaphor of folding a timeline visualization into itself so as to bring similar time points close to each other. This metaphor can be applied to any dataset where a similarity metric between temporal snapshots can be defined, thus it is largely datatype-agnostic. We illustrate how time curves can visually reveal informative patterns in a range of different datasets.
Functional Description
Time Curves are implemented in Java and JavaScript.