Section: New Results
Co-localization between proteins : testing procedure and generative models
Participants : Frédéric Lavancier, Thierry Pécot, Charles Kervrann.
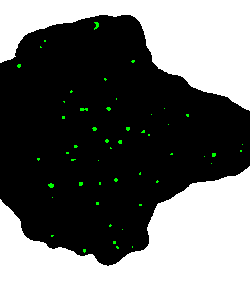
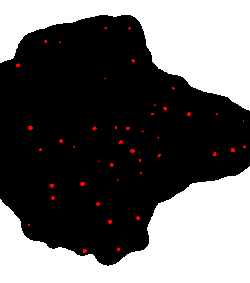
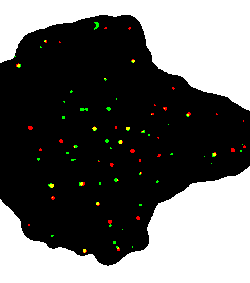
In the context of bioimaging, co-localization refers to the detection of emissions from two or more fluorescent molecules within the same pixel of the image. This approach enables to quantify the protein-protein interactions inside the cell, just at the resolution limit of the microscope. In statistics, this amounts to characterizing the joint spatial repartition and the spatial overlap between different fluorescent labels. An illustration of the co-localization of green (Langerin protein) and red (Rab11 GTPase protein) fluorescence is shown in Fig. 9 (the images were segmented by applying the Atlas algorithm [12] ). In our framework, the spatial repartition of proteins in the same cell is modeled by a union of random balls, possibly overlapping, and a Gibbs interaction is introduced to take into account the possible interaction between the two co-expressed proteins. A simulation algorithm is described and an inference procedure, based on the Takacs-Fiksel method, is proposed to estimate the interaction parameter. This estimation allows us to determine the presence of co-localization and to quantify the degree of interactions. On the other hand, this model can be used as a generator for synthesized images of co-localized proteins, in a view to assess testing procedures as the one explained below.
In an on-going project, we are developing a non-parametric testing procedure for co-localization. It is mainly based on the overlap area, corresponding to yellow spots as displayed in the right-hand side image of Fig. 9 . Our first experiments on synthesized images showed that our procedure is more powerful than all existing methods to detect co-localization. Moreover this testing procedure turns out to be robust to different shapes and sizes of objects segmented by any competitive algorithm.
Reference: [36]