Section: New Results
Reconstruction
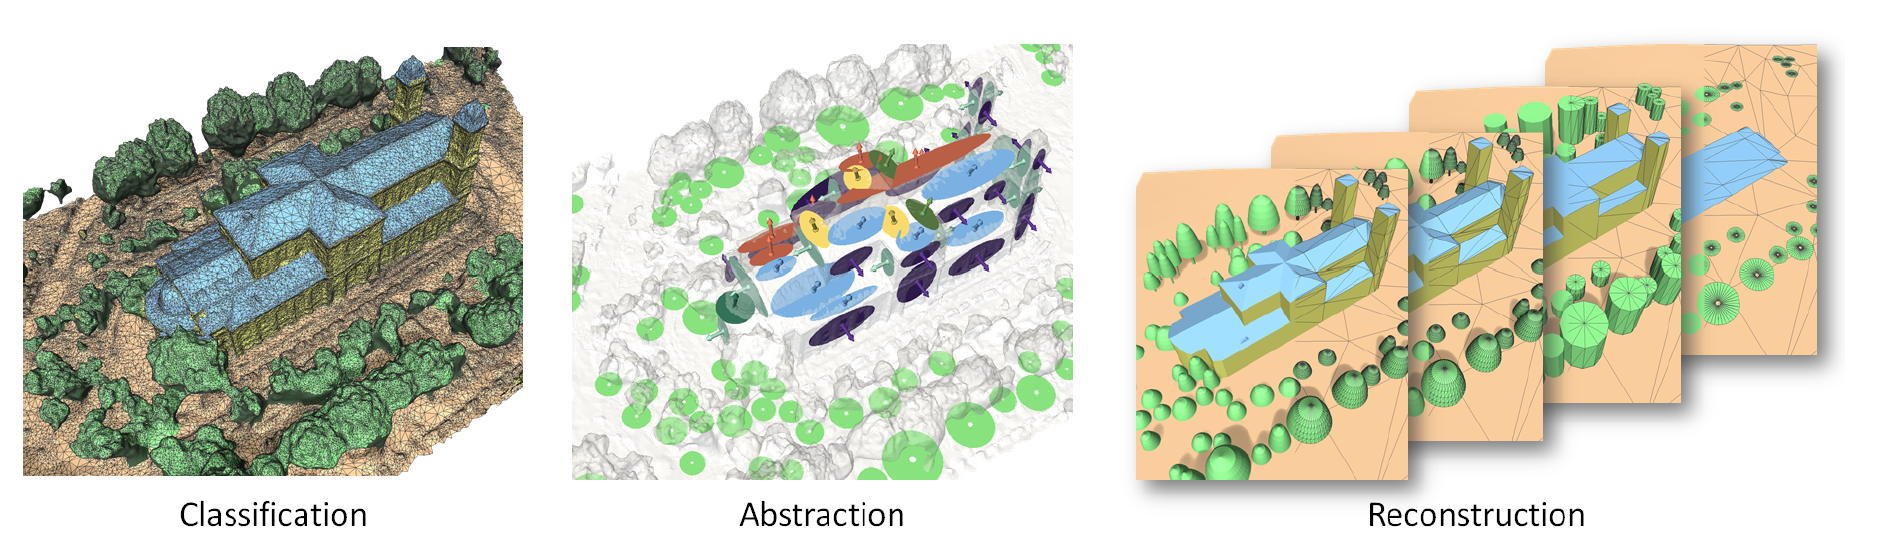
LOD Generation for Urban Scenes
Participants : Florent Lafarge, Pierre Alliez.
We contributed a novel approach that reconstructs 3D urban scenes in the form of levels of detail (LODs). Starting from raw data sets such as surface meshes generated by multi-view stereo systems, our algorithm proceeds in three main steps: classification, abstraction and reconstruction (Figure 5 ). From geometric attributes and a set of semantic rules combined with a Markov random field, we classify the scene into four meaningful classes. The abstraction step detects and regularizes planar structures on buildings, fits icons on trees, roofs and facades, and performs filtering and simplification for LOD generation. The abstracted data are then provided as input to the reconstruction step which generates watertight buildings through a min-cut formulation on a set of 3D arrangements. Our experiments on complex buildings and large scale urban scenes show that our approach generates meaningful LODs while being robust and scalable. By combining semantic segmentation and abstraction it also outperforms general mesh approximation approaches at preserving urban structures [10] . Published in the ACM Transactions on Graphics journal.
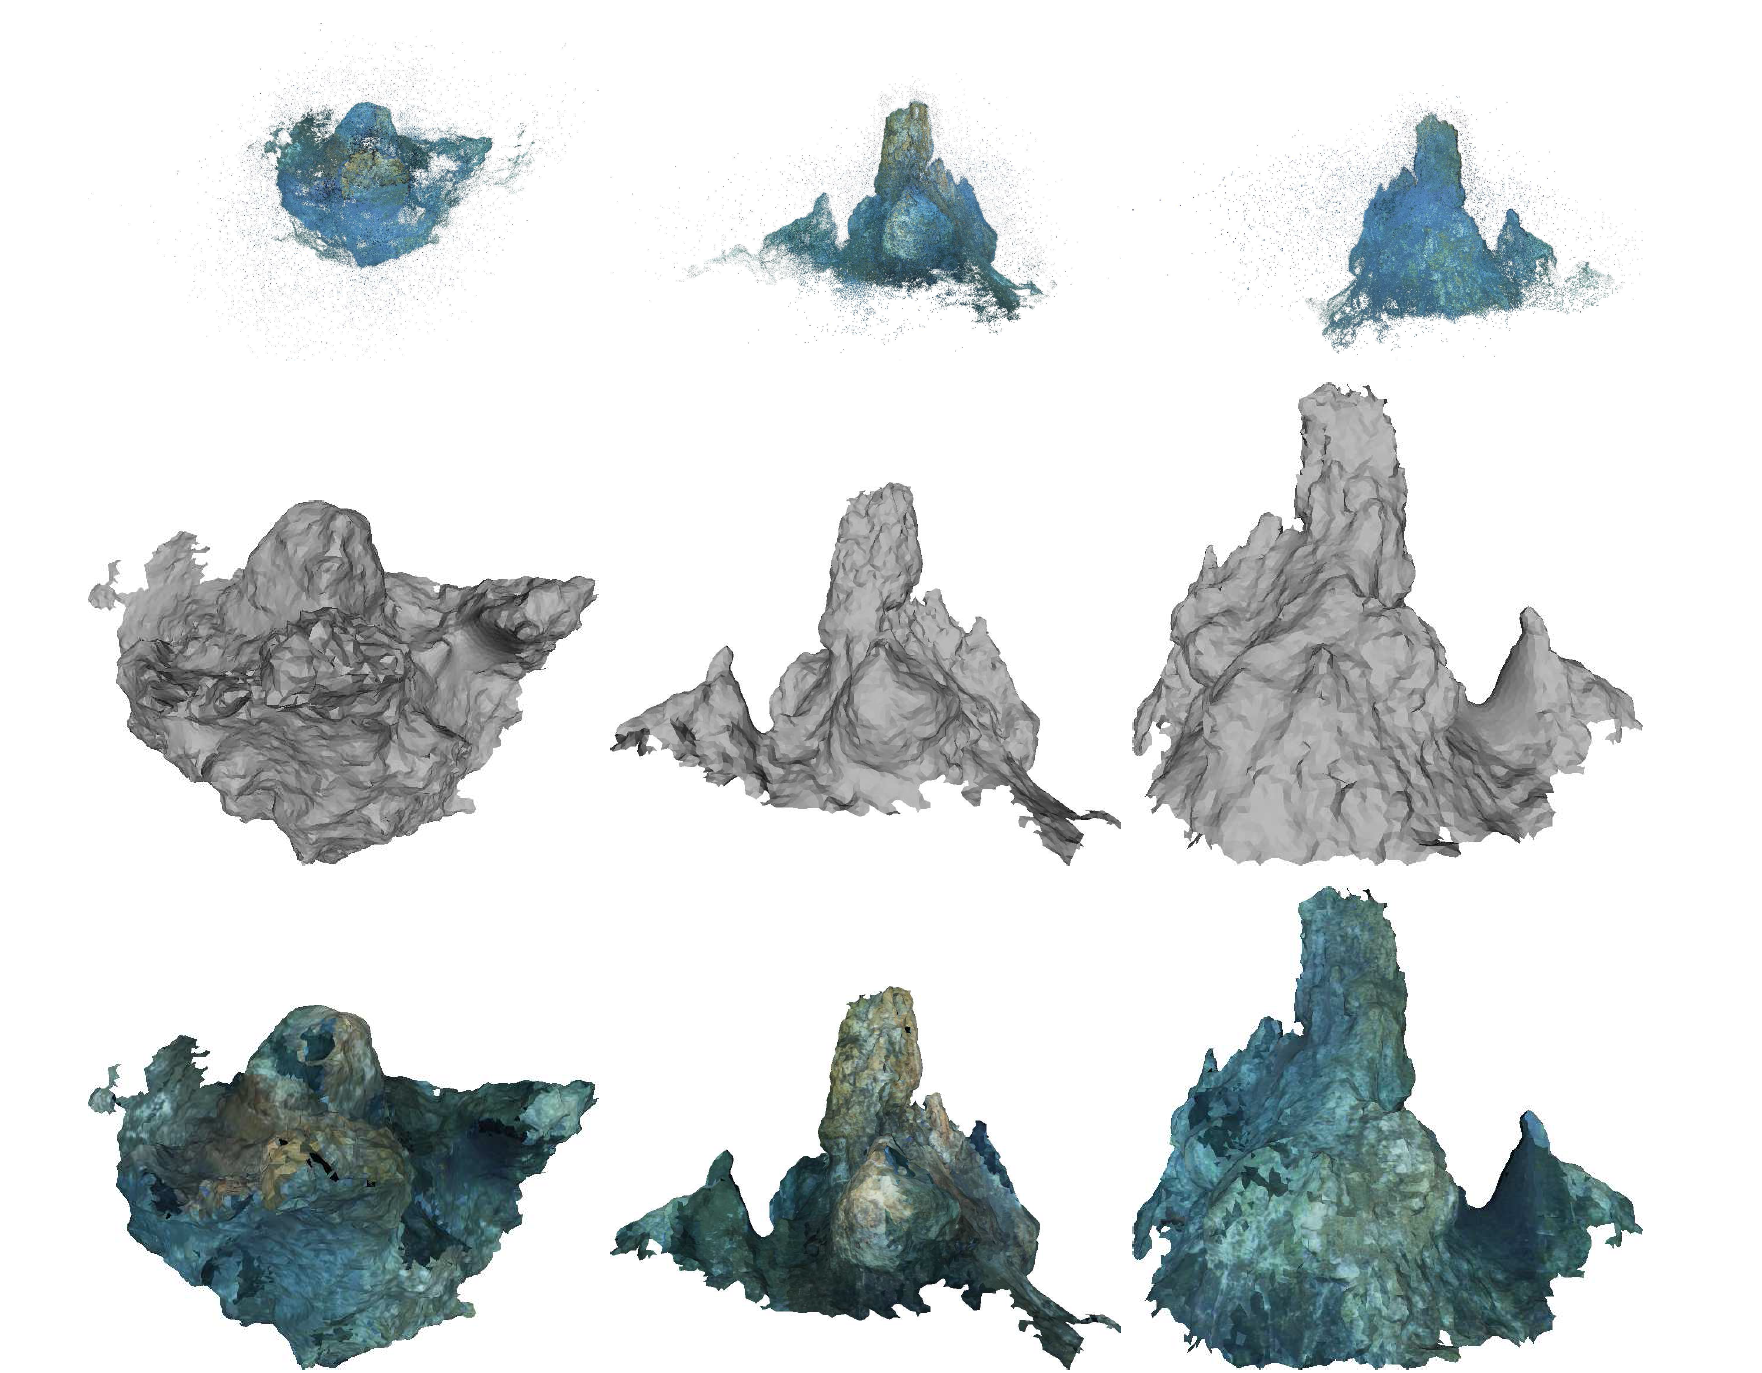
A Surface Reconstruction Method for In-Detail Underwater 3D Optical Mapping
Participant : Pierre Alliez.
In collaboration with Ricard Campos and Rafael Garcia from the Computer Vision and Robotics Group from University of Girona, and Mariette Yvinec from the GEOMETRICA Inria project-team.
Underwater range scanning techniques are starting to gain interest in underwater exploration, providing new tools to represent the seafloor. These scans (often) acquired by underwater robots usually result in an unstructured point cloud, but given the common downward-looking or forward-looking configuration of these sensors with respect to the scene, the problem of recovering a piecewise linear approximation representing the scene is normally solved by approximating these 3D points using a heightmap (2.5D). Nevertheless, this representation is not able to correctly represent complex structures, especially those presenting arbitrary concavities normally exhibited in underwater objects. We present a method devoted to full 3D surface reconstruction that does not assume any specific sensor configuration. The method presented is robust to common defects in raw scanned data such as outliers and noise often present in extreme environments such as underwater, both for sonar and optical surveys (Figure 6 ). Moreover, the proposed method does not need a manual preprocessing step. It is also generic as it does not need any information other than the points themselves to work. This property leads to its wide application to any kind of range scanning technologies and we demonstrate its versatility by using it on synthetic data, controlled laser-scans, and multibeam sonar surveys. Finally, and given the unbeatable level of detail that optical methods can provide, we analyze the application of this method on optical datasets related to biology, geology and archeology [4] . Published in the International Journal of Robotics Research.
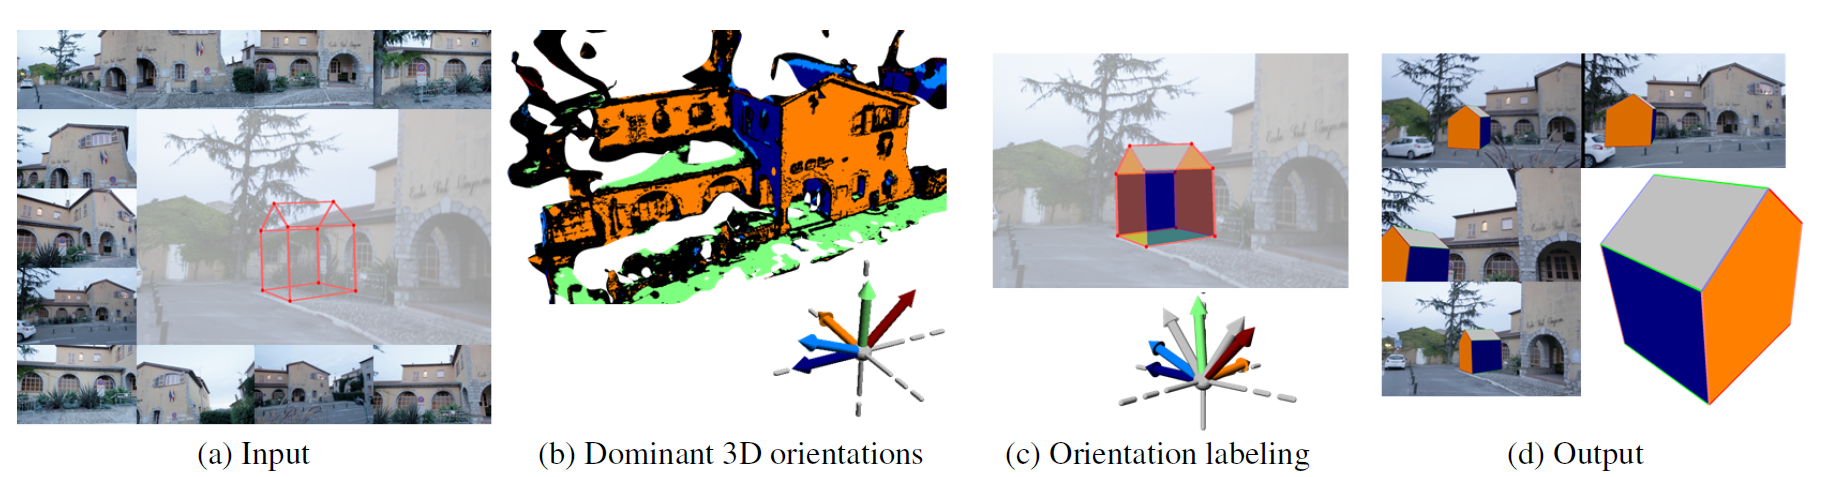
Line Drawing Interpretation in a Multi-View Context
Participants : Jean-Dominique Favreau, Florent Lafarge.
In collaboration with Adrien Bousseau from the Inria project-team GraphDeco.
Many design tasks involve the creation of new objects in the context of an existing scene. Existing work in computer vision only provides partial support for such tasks. On the one hand, multi-view stereo algorithms allow the reconstruction of real-world scenes, while on the other hand algorithms for line-drawing interpretation do not take context into account. Our work combines the strength of these two domains to interpret line drawings of imaginary objects drawn over photographs of an existing scene. The main challenge we face is to identify the existing 3D structure that correlates with the line drawing while also allowing the creation of new structure that is not present in the real world. We propose a labeling algorithm to tackle this problem, where some of the labels capture dominant orientations of the real scene while a free label allows the discovery of new orientations in the imaginary scene (Figure 7 ). We illustrate our algorithm by interpreting line drawings for urban planing, home remodeling, furniture design and cultural heritage [18] . Published in the proceedings of CVPR (IEEE conference on Computer Vision and Pattern Recognition).
|
Marked point process model for curvilinear structures extraction
Participant : Yuliya Tarabalka [contact] .
In collaboration with Seong-Gyun Jeong and Dr. Josiane Zerubia (AYIN team, Inria-SAM).
In this work, we proposed a new marked point process (MPP) model and the associated optimization technique to extract curvilinear structures [12] . Given an image, we compute the intensity variance and rotated gradient magnitude along the line segment. We constrain high level shape priors of the line segments to obtain smoothly connected line configuration. The optimization technique consists of two steps to reduce the significance of the parameter selection in our MPP model. We employ a Monte Carlo sampler with delayed rejection to collect line hypotheses over different parameter spaces. Then, we maximize the consensus among line detection results to reconstruct the most plausible curvilinear structures without parameter estimation process. Experimental results (see Figure 8 ) show that the algorithm effectively localizes curvilinear structures on a wide range of datasets.
|
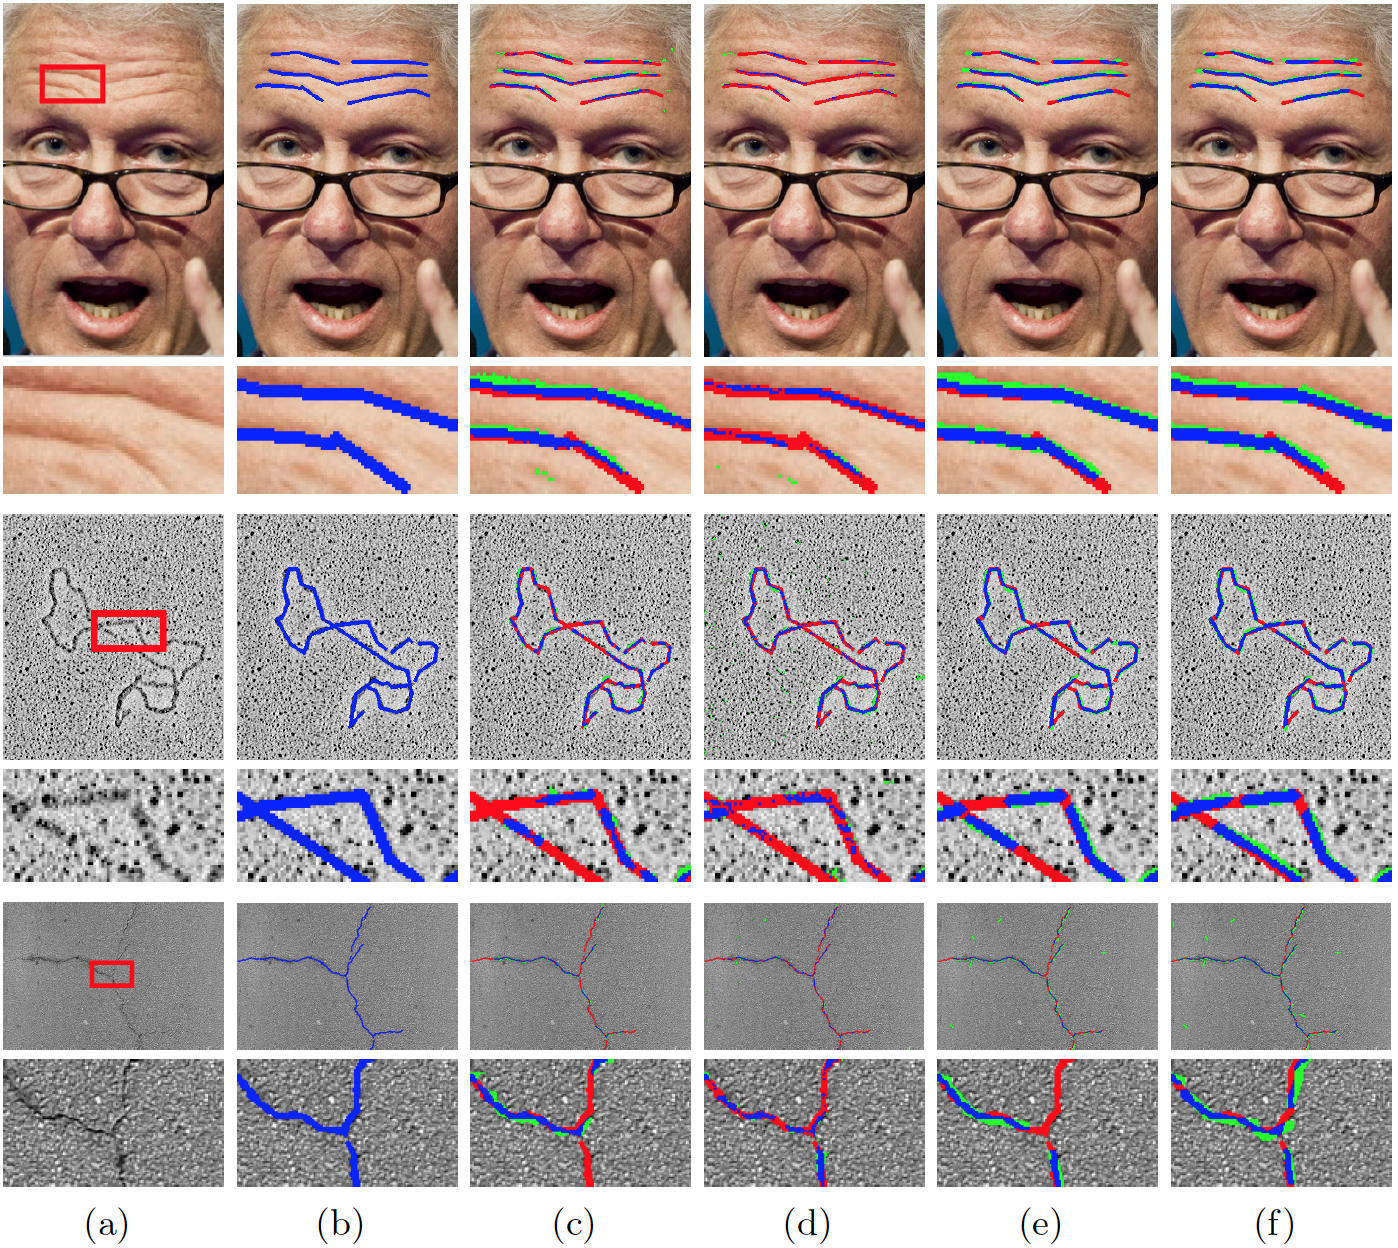
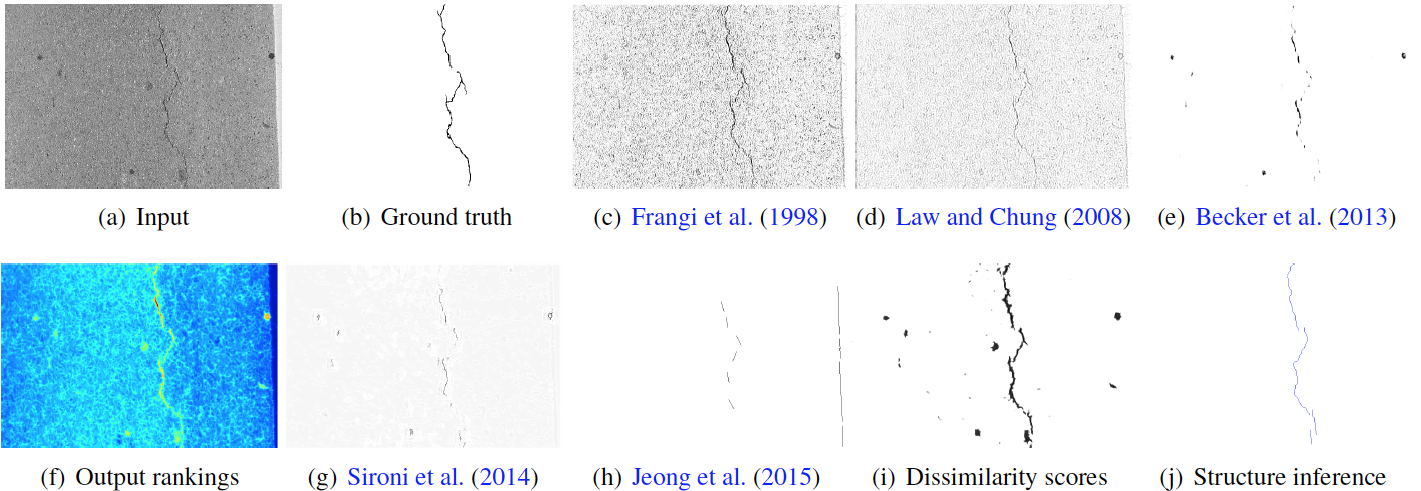
Inference of curvilinear structure based on learning a ranking function and graph theory
Participant : Yuliya Tarabalka [contact] .
In collaboration with Seong-Gyun Jeong and Dr. Josiane Zerubia from the AYIN team and Dr. Nicolas Nisse from the COATI project-team.
Curvilinear structure extraction, inference of structured data, ranking learning, graphical model, shape simplification.
To detect curvilinear structures in natural images, we proposed a novel ranking learning system and an abstract curvilinear shape inference algorithm based on graph theory. We analyze the curvilinear structures as a set of small line segments. In this work, the rankings of the line segments are exploited to systematize the topological feature of the curvilinear structures. A Structured Support Vector Machine is employed to learn the ranking function that predicts the correspondence of the given line segments and the latent curvilinear structures. We first extract curvilinear features using morphological profiles and steerable filter responses. Also, we propose an orientation-aware feature descriptor and a feature grouping operator to improve the structural integrity during the learning process. To infer the curvilinear structure, we build a graph based on the output rankings of the line segments. We progressively reconstruct the curvilinear structure by looking for paths between remote vertices in the graph. Experimental results (see Figure 9 for an example of the experimental results' comparison on the crack dataset) show that the proposed algorithm faithfully detects the curvilinear structures within various datasets.