

Section: New Results
Interacting with the Semantic Web of Linked Data
|
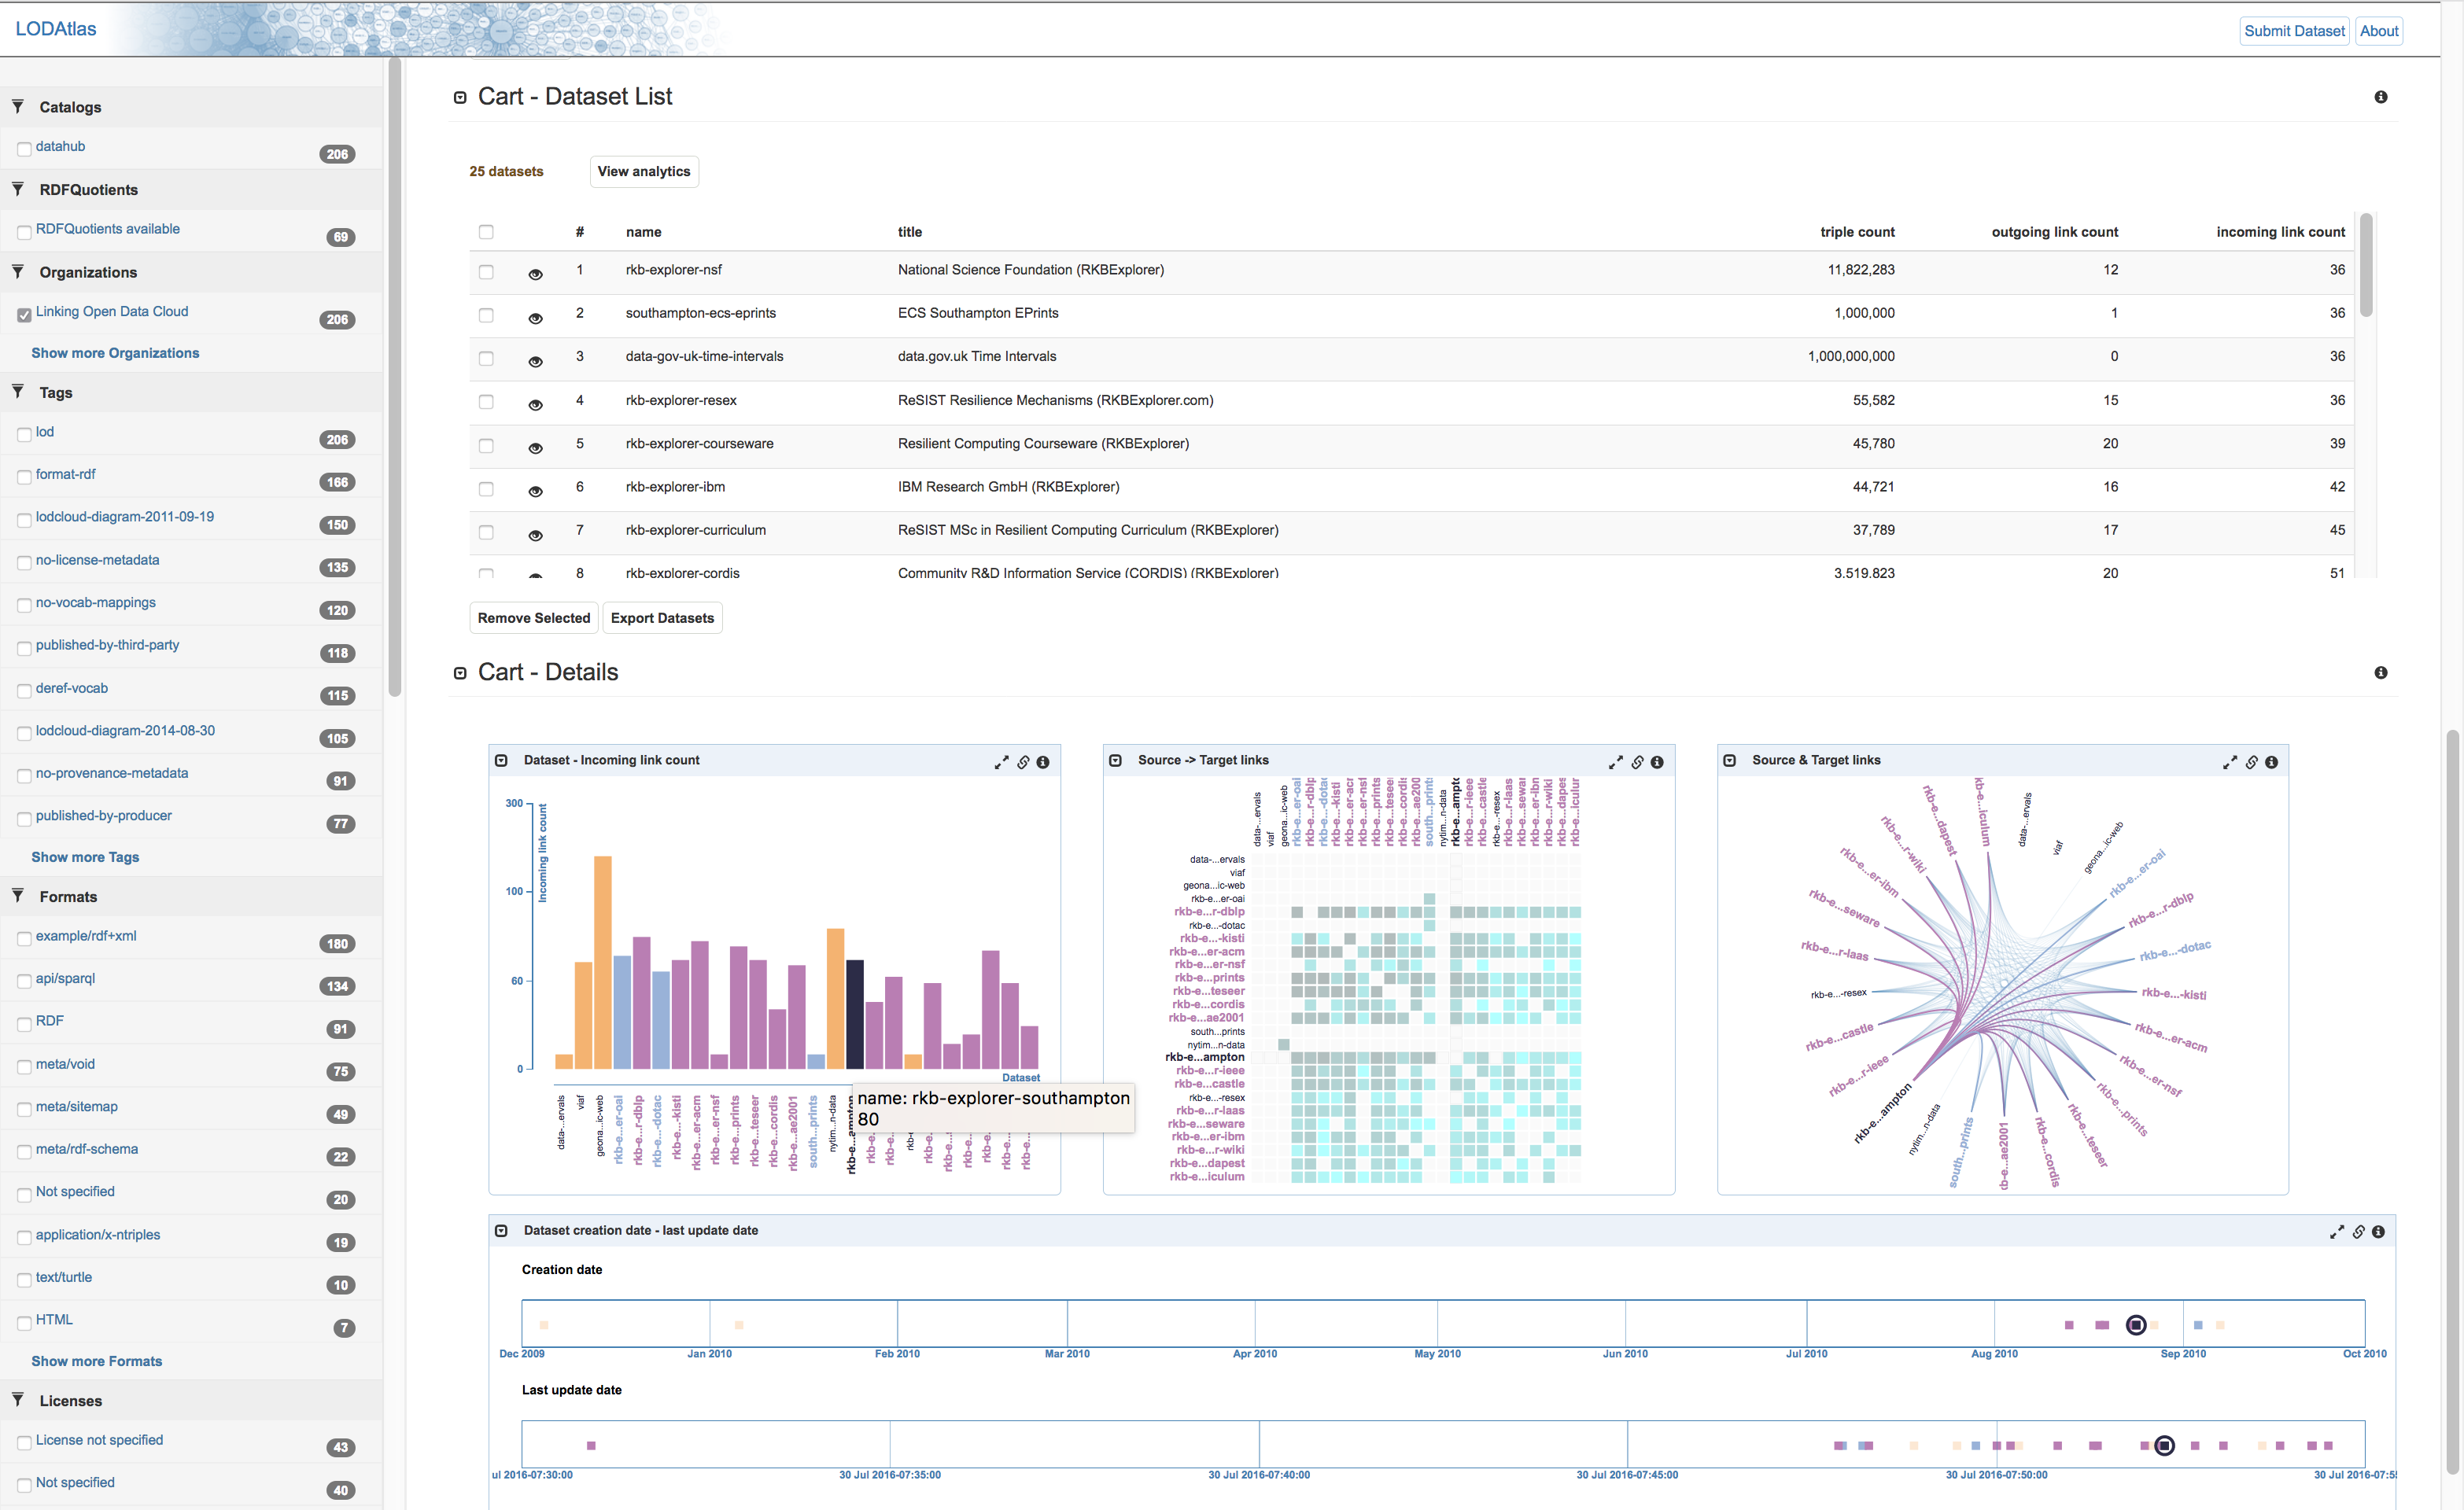
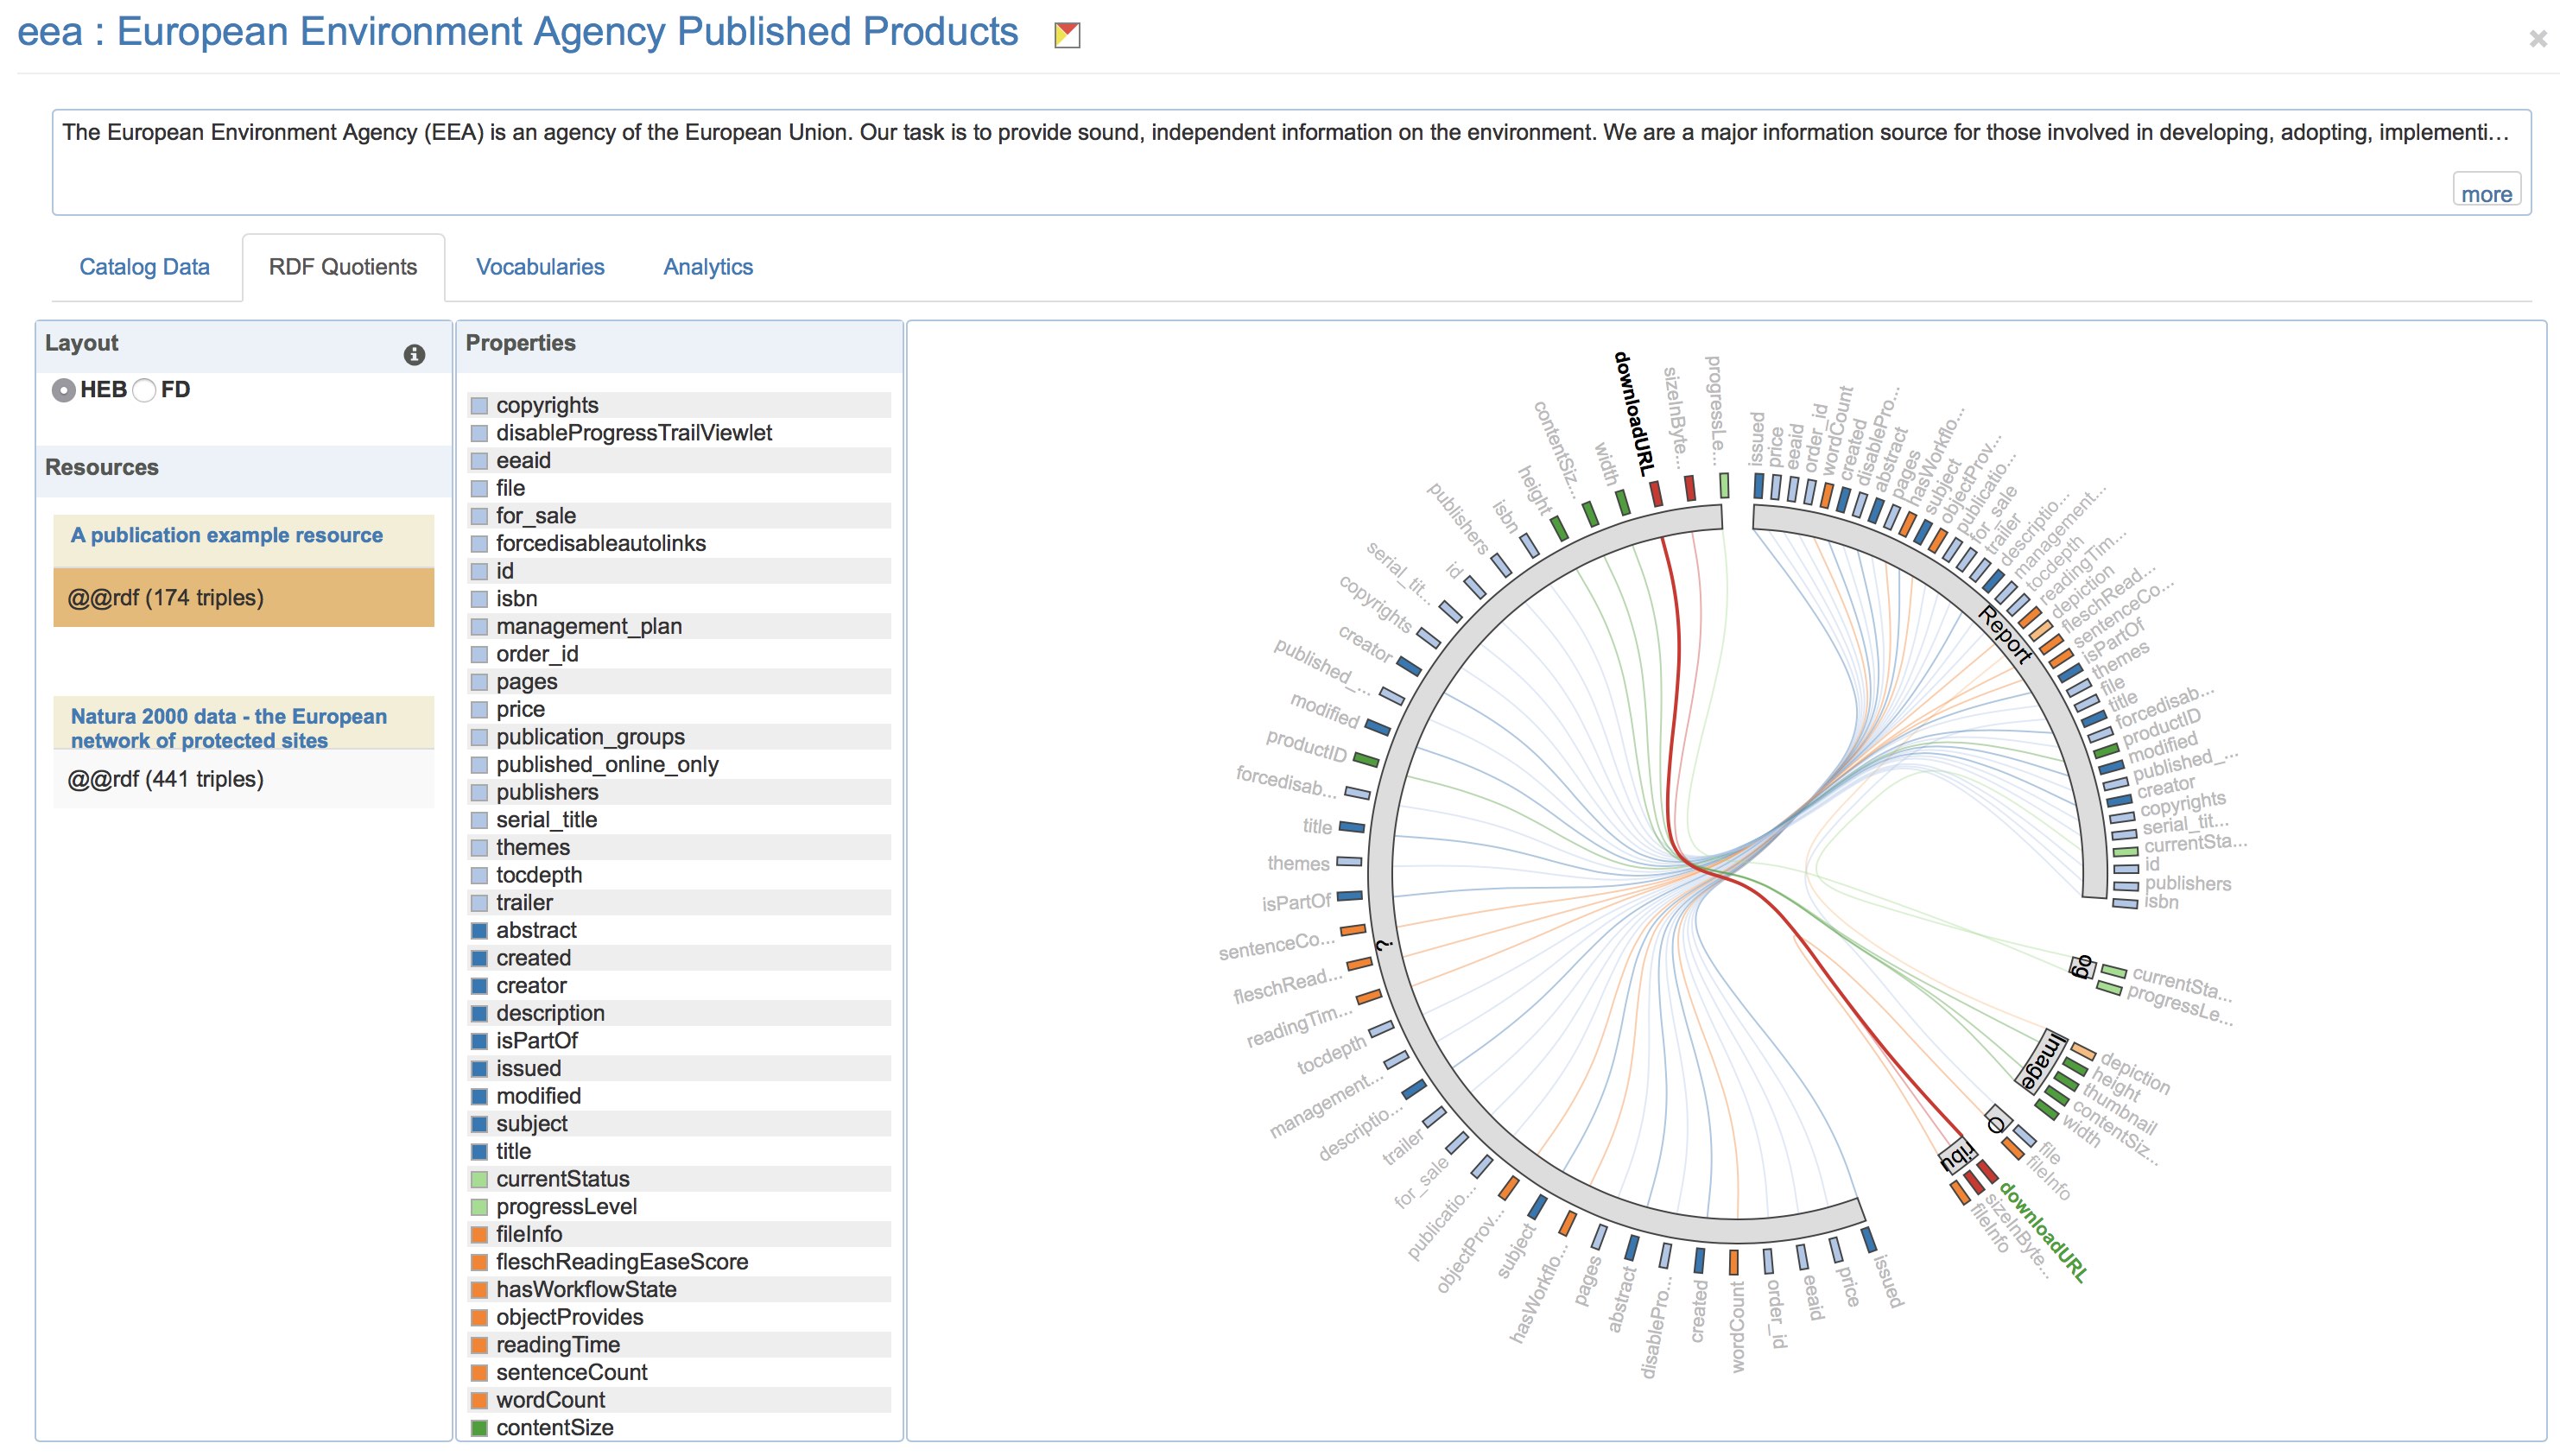
The Web of Data is growing fast, as exemplified by the evolution of the Linked Open Data (LOD) cloud over the last ten years. One of the consequences of this growth is that it is becoming increasingly difficult for application developers and end-users to find the datasets that would be relevant to them. Semantic Web search engines, open data catalogs, datasets and frameworks such as LODStats and LOD Laundromat, are all useful but only give partial, even if complementary, views on what datasets are available on the Web. We started working on a platform called LODAtlas in 2016. LODAtlas [22] is a portal that enables users to find datasets of interest (see Figure 6) . Users can make different types of queries about both the datasets' metadata and contents, aggregated from multiple sources. They can then quickly evaluate the matching datasets' relevance, thanks to summary visualizations of their general metadata, connections and contents. The latter has been developed in collaboration with project-team CEDAR, based on their recent work on RDF Quotients.
Linked Data is structured as a directed labeled graph, or more precisely as a multitude of such graphs, that can be interlinked and distributed over the World Wide Web. Graph structures play an essential role at different scales in the Web of Data, and while it is now clear that basic approaches based on node-link diagram representations are only useful for small datasets, such visualizations remain meaningful for the representation of subsets of these multi-variate data. As part of a larger effort that started in the summer of 2016 to investigate novel interactive visual exploration techniques for multi-variate graphs, we introduced a design space and Web-based framework for generating what we call animated edge textures. Network edge data attributes are usually encoded using color, opacity, stroke thickness and stroke pattern, or some combination thereof. But in addition to these static variables, it is also possible to animate dynamic particles flowing along the edges. These can be seen as animated edge textures, that offer additional visual encodings that have potential not only in terms of visual mapping capacity but also playfulness and aesthetics. While such particle-based visual encodings have been featured in several commercial and design-oriented visualizations, this has to our knowledge almost always been done in a relatively ad hoc manner. Beyond the design space and Web framework, we also conducted an initial evaluation of particle properties – particle speed, pattern and frequency – in terms of visual perception. This work [24] was performed in collaboration with Nathalie Henry-Riche from Microsoft Research and Benjamin Bach from Edimburgh University.