Section: New Results
3D flow estimation in 3D fluorescence microscopy image sequences
Participants : Sandeep Manandhar, Patrick Bouthemy, Charles Kervrann.
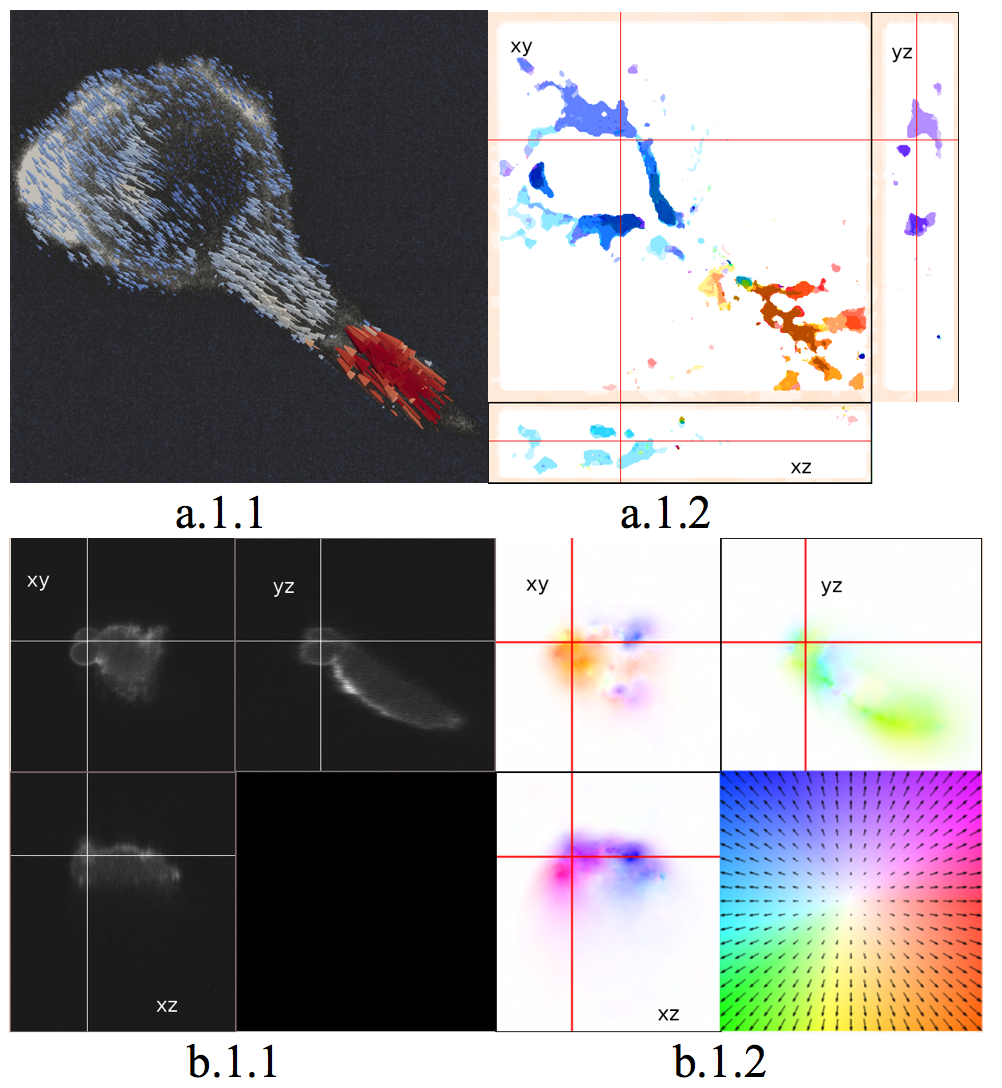
Three-dimensional (3D) motion estimation for light-sheet microscopy is challenged by the heterogeneous scales and nature of intracellular dynamics. As typical examples in cell imaging, blebbing of a cell has small motion magnitude, while cell migration may show large displacement between frames. To tackle this problem, we have designed a two-stage 3D optical flow method. The first stage involves an extension of two-dimensional PatchMatch paradigm to 3D data, which in addition operates in a coarse-to-fine manner. We exploit multiple spatial scales to explore the possible range of intracellular motions. Our findings show that the metric based on Census transform is more robust to noise and to intensity variation between time steps. Only discrete displacements are estimated in this stage. Then, in a second stage, a 3D variational method enables to recover a sub-voxel dense 3D flow map. The variational approach still involves a data fidelity term based on the Census transform. The combination of the 3D PatchMatch and the 3D variational method is able to capture both large and small displacements. We assessed the performance of our method on data acquired with two different light sheet microscopes and compared it with a couple of other methods. The dataset depicts blebbing and migration of MV3 melanoma cells, and collagen network displacement induced by cell motility. As seen in Fig. 7, our method is able to successfully estimate various range of motion during cell migration and blebbing. A straightforward way to visualize the resulting 3D flow field is to use 3D glyphs (arrows), which represent vector direction and magnitude. However, it may not lead to easy understanding for visualization in 3D and over time. Consequently, we propose to visualize 2D projections of 3D flow field in 3 orthogonal planes (see Figure 7 a.1.2 and b.1.2). Using the standard Middlebury-style color coding for 2D optic flow, the motion field becomes easier to understand. This work is carried out in collaboration with UTSW Dallas int the frame of the Inria associated team CytoDI.
Collaborators: Philippe Roudot and Erik Welf (UTSW, Dallas, USA).
|